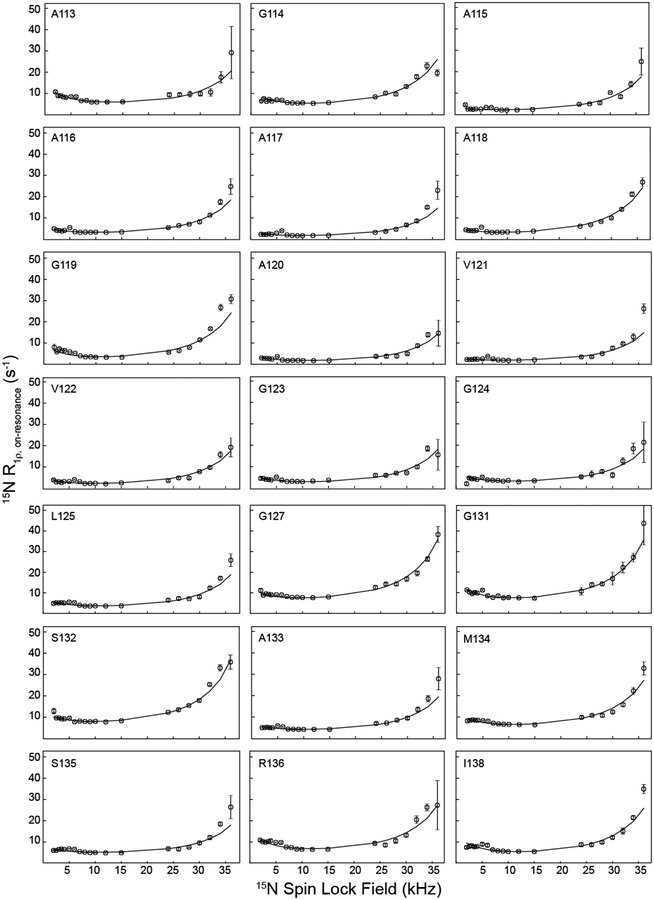
Figure 2.
Residue-specific 15N R1ρ RD profiles for huPrP23–144 amyloid fibrils at 800 MHz 1H frequency. Experimental data are shown as open circles, and numerical fits used to extract the global exchange rate and minor excited-state population, as well as site-specific parameters Δω and α (c.f., Figure 3) are shown as solid lines. RD profiles for residues G126, L130, and F141, which were not fit as well by the global exchange model, are shown in SI Figure S5 along with individual residue-specific fits. RD profiles for residues I139 and H140 could not be obtained due to insufficient resolution in the 2D 15N-1H spectrum.

