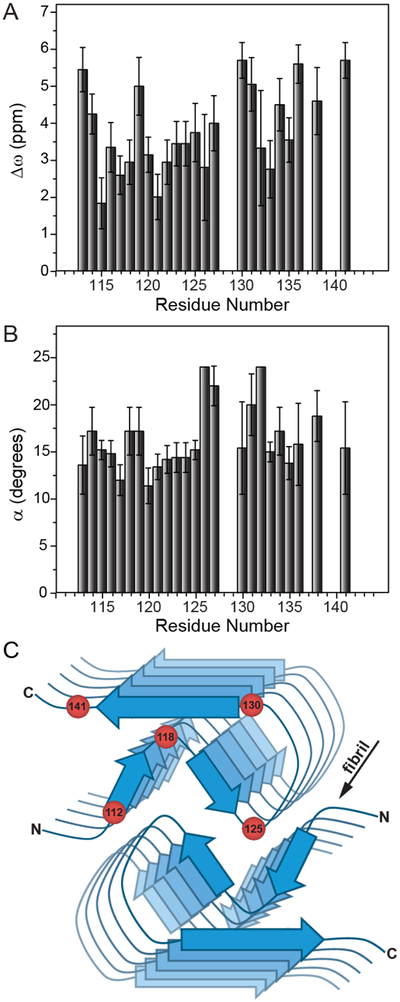
Figure 3.

Plots of residue-specific (A) Δω and (B) α values extracted from the global fit of 15N R1ρ RD profiles for huPrP23–144 amyloid with kex = 1000 s−1 and pB = 2%. The residue-specific Δω and α values and uncertainties shown in the plots correspond to the average and standard deviation for these values obtained from a set of 10 calculated RD profiles having the lowest χ2 to the experimental data. Note that the α values obtained for residues 126 and 132 using the global fit were near the edge of the grid for that parameter, and consequently no error bars are reported for these two residues. (C) Schematic structural model of the huPrP23–144 fibril with approximate locations of several amino acid residues indicated by red spheres.
