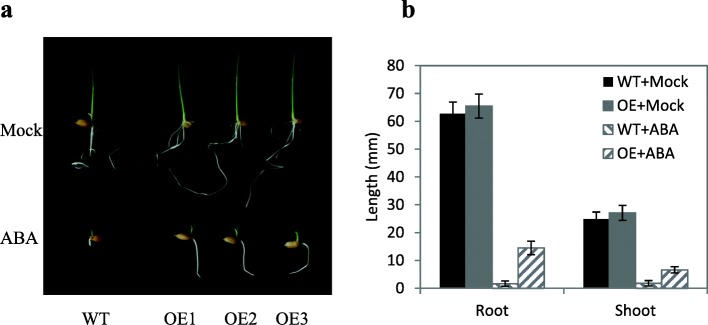
Fig. 3.
Decreased ABA sensitivity in OE lines. a, Growth performance of OE lines and WT on 1%(w/v) agar without or with 10 μM ABA. In mock treatment, agar contained equal amount of solvent. b, Length of shoot and root of OE lines after 3 days of treatment. Shoot and root lengths were measured after 3 days of culture in the light at 30 °C.Values represent the mean ± SD of three OE lines (ten replicates/line)

