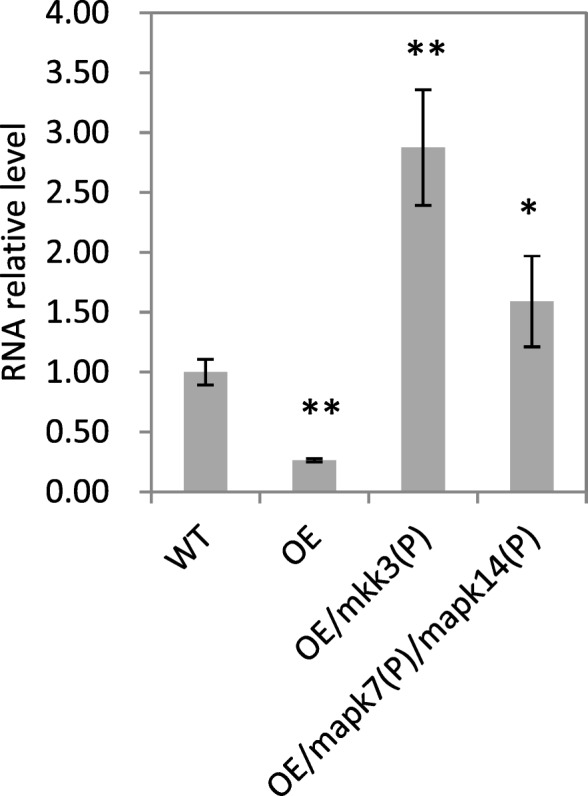
Fig. 6.

Relative transcript levels of OsMFT in different transgenic materials. Transcript level of OsMFT was analyzed by real-time PCR using seeds collected at 23 DAH. Values shown are the mean ± SD of triplicate independent biological samples (n = 3). Transcript level was normalized to that of OsMFT in WT. Student’s t-tests were used to generate P values
