
Fig. 2.
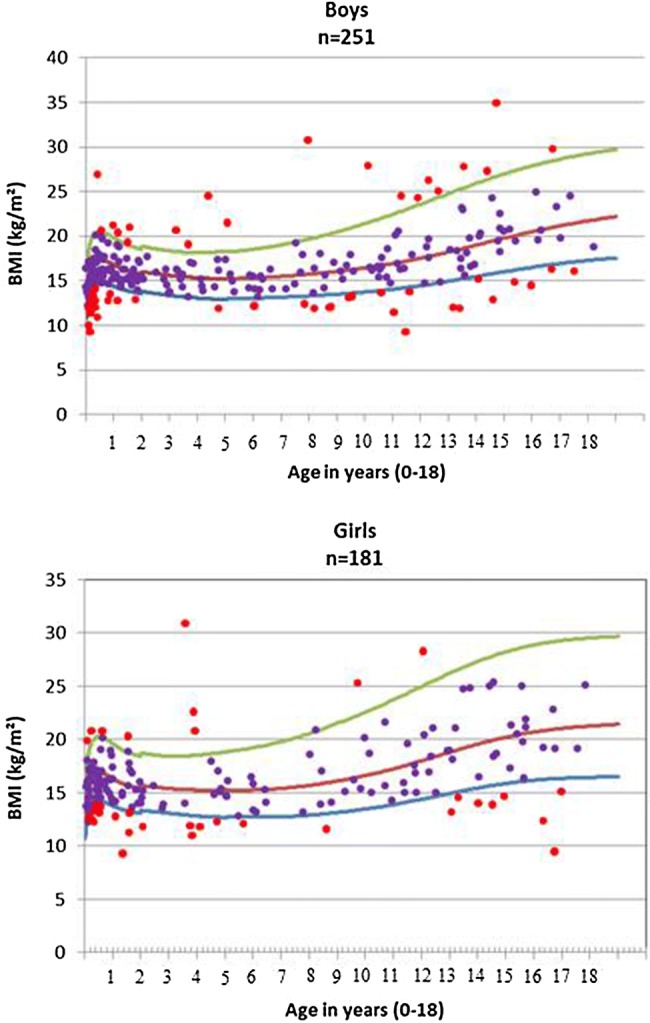
Body mass index (BMI) distribution among girls and boys, according to WHO references (curves represent − 2 SD, mean and + 2SD, respectively). SD: standard deviation for age and gender
Official websites use .gov
A
.gov website belongs to an official
government organization in the United States.
Secure .gov websites use HTTPS
A lock (
) or https:// means you've safely
connected to the .gov website. Share sensitive
information only on official, secure websites.
Body mass index (BMI) distribution among girls and boys, according to WHO references (curves represent − 2 SD, mean and + 2SD, respectively). SD: standard deviation for age and gender