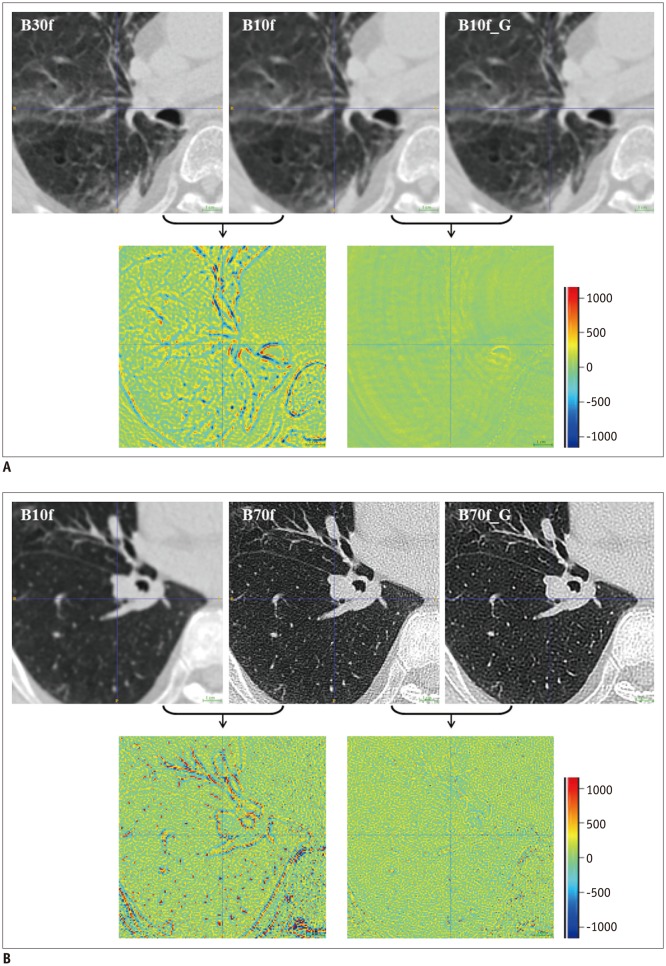
Fig. 2. Comparisons of original and converted CT images using CNN.
Input image, ground-truth image, and converted image are presented on upper panel, and difference images are located on bottom panel. In difference image, green indicates zero, blue represents negative values, and red indicates positive values.
A. Pronounced differences between B10f and B30f images mostly disappeared after applying proposed conversion scheme (RMSE from 16.95 HU to 3.12 HU). B. Similar results were observed in kernel conversion from B10f to B70f (RMSE from 149.06 HU to 99.21 HU). However, speckled error regions remained owing to difficulties in kernel conversion from B10f to B70f and high signal-to-noise ratio in B70f. HU = Hounsfield unit, RMSE = root mean square error

