
Fig. 2.
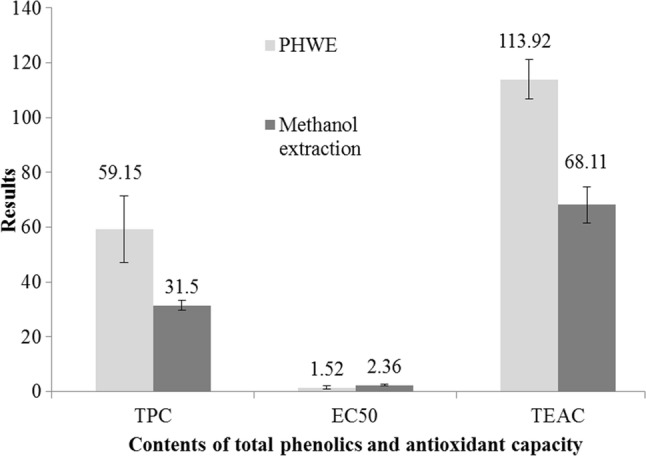
Comparison of extraction methods (bars show mean ± standard deviations of three replicates. White and black bars are for PHWE and conventional methanol extraction, respectively. Individual averaged values of analyses are shown on top of the bars)