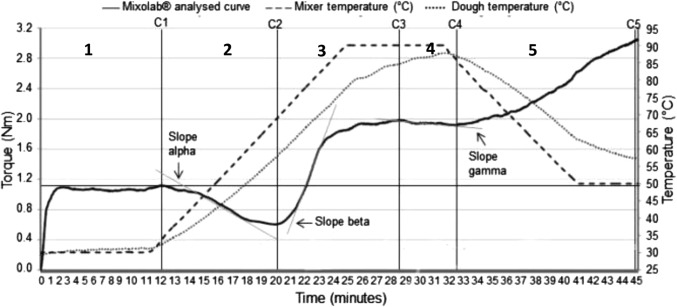
Fig. 1.
Typical Mixolab curves comparing the rheological behaviours of dough. The description of a Mixolab curve/points obtained. The numbers indicate the different zones detected in the curve according to physical dough changes. C1—dough development time and stability, C2—protein weakening pattern, and dough elasticity, C3—maximum viscosity, C4—amylolysis pattern, C5—retrogradation. The behavior of Mixolab dough constitutes, where α: represents protein weakening speed under heat; β: represents starch gelatinization speed and γ: represents enzyme, degradation speed (1), dough development time (2), protein reduction during heating (3), starch gelatinization (4), amylase activity (5) and starch gelling due to cooling

