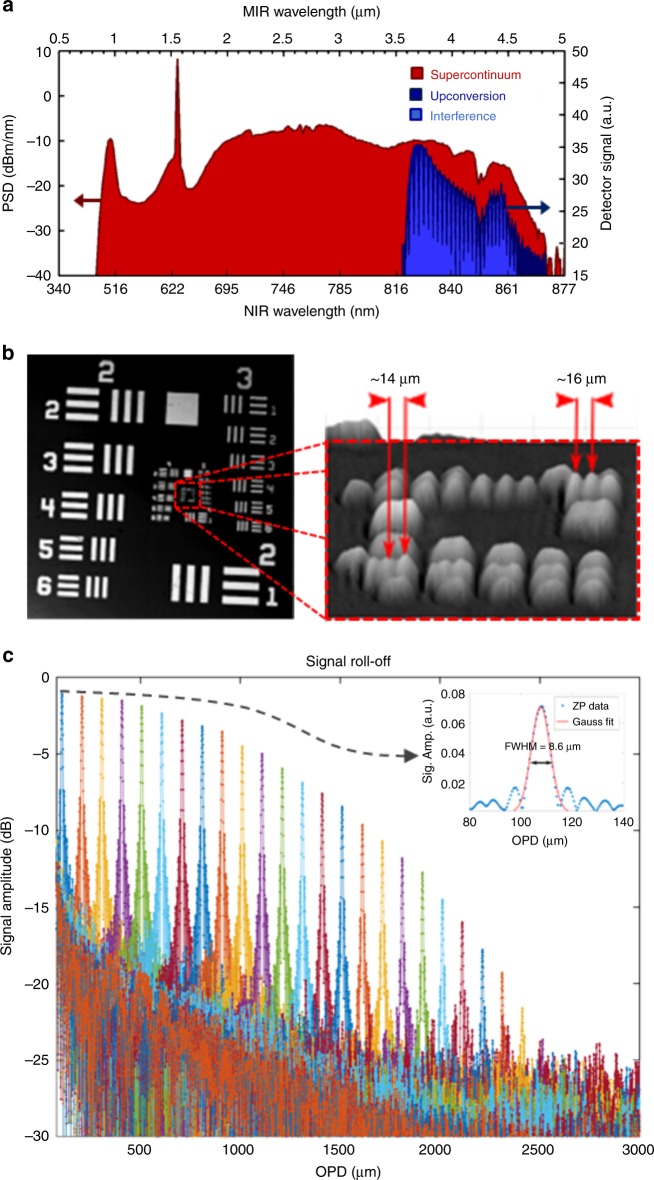
Fig. 2. Characterization of the 4-μm OCT system.
a Superposition of the SC spectra before (red) and after (dark blue) upconversion together with an example of the interference spectrum (light blue). b Lateral spatial resolution characterization using an USAF 1951 (left) resolution test target. The smallest resolvable features in the image (right) are elements 1 and 2 in group 6 marked by red arrows, which gives a lateral resolution of ~15 μm. c Sensitivity roll-off curve showing an axial range of up to 2.5-mm OPD. The inset shows a Gaussian fit of the zero-padded A-scan peak at ~100 μm OPD, giving a FWHM axial resolution of 8.6 μm. OCT optical coherence tomography, SC supercontinuum, OPD optical path difference, FWHM full-width half-maximum

