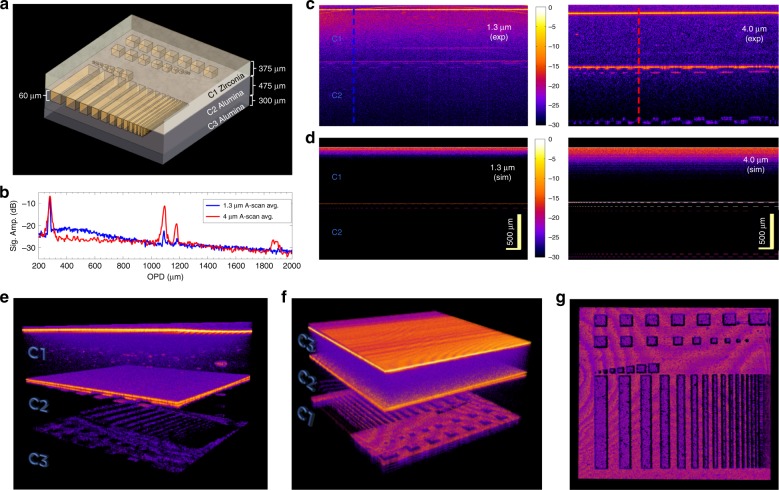
Fig. 3. Proof of principle OCT imaging of a laser-milled ceramic stack.
a Schematic of the sample consisting of three layers of ceramics (C1–C3), where C1 is a 375-μm-thick zirconia plate, C2 is a 475-μm-thick alumina plate with up to 60-μm deep features of varying widths between 5- and 300-μm laser inscribed onto the surface, and C3 is a 300-μm alumina plate. b Average of ten representative A-scans for the two OCT systems, as measured from the top of the sample (C1 → C2 → C3). c Comparison between B-scans using the 1.3-μm OCT (left) and 4-μm OCT systems (right). Dashed lines illustrate the position of the A-scans shown in b. d Monte Carlo simulations of the experiments in c. The scale bar is 500 μm in air. e, f 3D 4-μm OCT volume visualizations of the sample illuminating from the top (C1 → C2 → C3) and the bottom (C3 → C2 → C1), respectively. g En face view of the microstructures imaged through 775 μm of alumina. OCT optical coherence tomography

