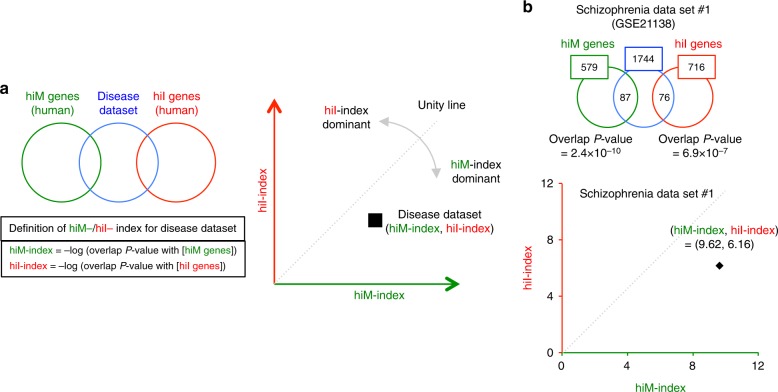
Fig. 2.
Overview of the two-dimensional (2-D) analysis of disease datasets. a Genes with expression changes in the disease datasets are compared with the hiM and hiI gene groups. The hiM- and hiI-indexes were defined as the −log of the overlap P values with the hiM and hiI genes, respectively. The gene-expression patterns of the disease datasets are plotted in two-dimensional coordinates, in which the x- and y-axes are defined by the hiM- and hiI-indexes. Each dataset is characterized as hiM- or hiI-dominant by the ratio of the hiM-index to the hiI-index, and the degree of hiM- or hiI-dominance is evaluated by deviation from the unity line. The distance of each dataset from the origin shows the degree of overlap with hiM-/hiI-genes. b 2-D analysis applied to a dataset of postmortem brains (prefrontal cortex) from patients with schizophrenia (schizophrenia dataset #1). The expression levels of 1744 genes are significantly changed in this disease dataset. Of these, 87 and 76 genes overlap with the hiM/hiI genes. The overlap P values between the disease dataset and the hiM/hiI genes are 2.4 × 10⁻¹⁰ and 6.9 × 10⁻⁷. The hiM- and hiI-indexes for the disease dataset are therefore 9.62 and 6.16, indicating that this dataset is hiM-dominant. The results of the 2-D analysis for this dataset are plotted in the two-dimensional coordinates defined by the hiM- and hiI-indexes

