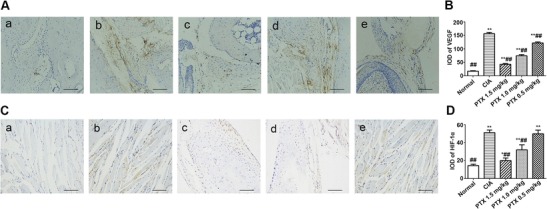
Fig. 4.

a, c Immunohistochemical staining of VEGF and HIF-1α in hind paw sections from mice from CIA, normal, and three PTX treatment groups (scale bar = 100 μm): a normal group, b CIA group, c PTX 1.5 mg/kg group, d PTX 1.0 mg/kg group, and e PTX 0.5 mg/kg group. Strong positive staining was observed in the CIA mice, while the mice treated with PTX exhibited weaker staining. b, d The stained samples were randomly selected in three different microscopic fields (×200) for each paw. Quantification of VEGF and HIF-1α-positive staining using Image-Pro Plus 6.0. Values are presented as the mean ± SEM. *p < 0.05, **p < 0.01 compared with the normal control group, #p < 0.05, ##p < 0.01 compared with the CIA group
