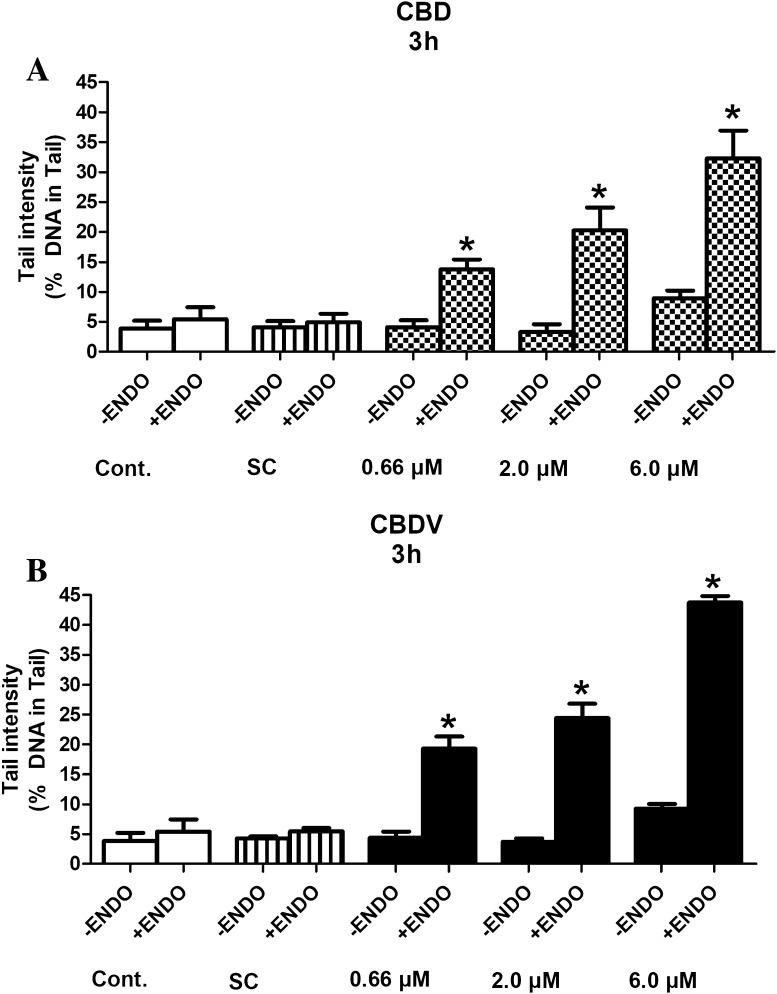
Fig. 6.
a, b Formation of oxidized pyrimidines in HepG2 cells by CBD and CBDV. The cells were exposed to the test compounds for 3 h. Subsequently, the nuclei were isolated after lysis and treated with ENDO III or with the corresponding buffers before electrophoresis for 45 min. Bars indicate means ± SD of results obtained with two cultures per experimental point. From each culture, two slides were made and 50 cells were evaluated per slide. Stars indicate statistical significance (p ≤ 0.05, ANOVA). All statistical calculations are based on comparisons between results which were obtained with cells which had been treated with the test compounds and results which were obtained with corresponding solvent controls

