Fig. 1.
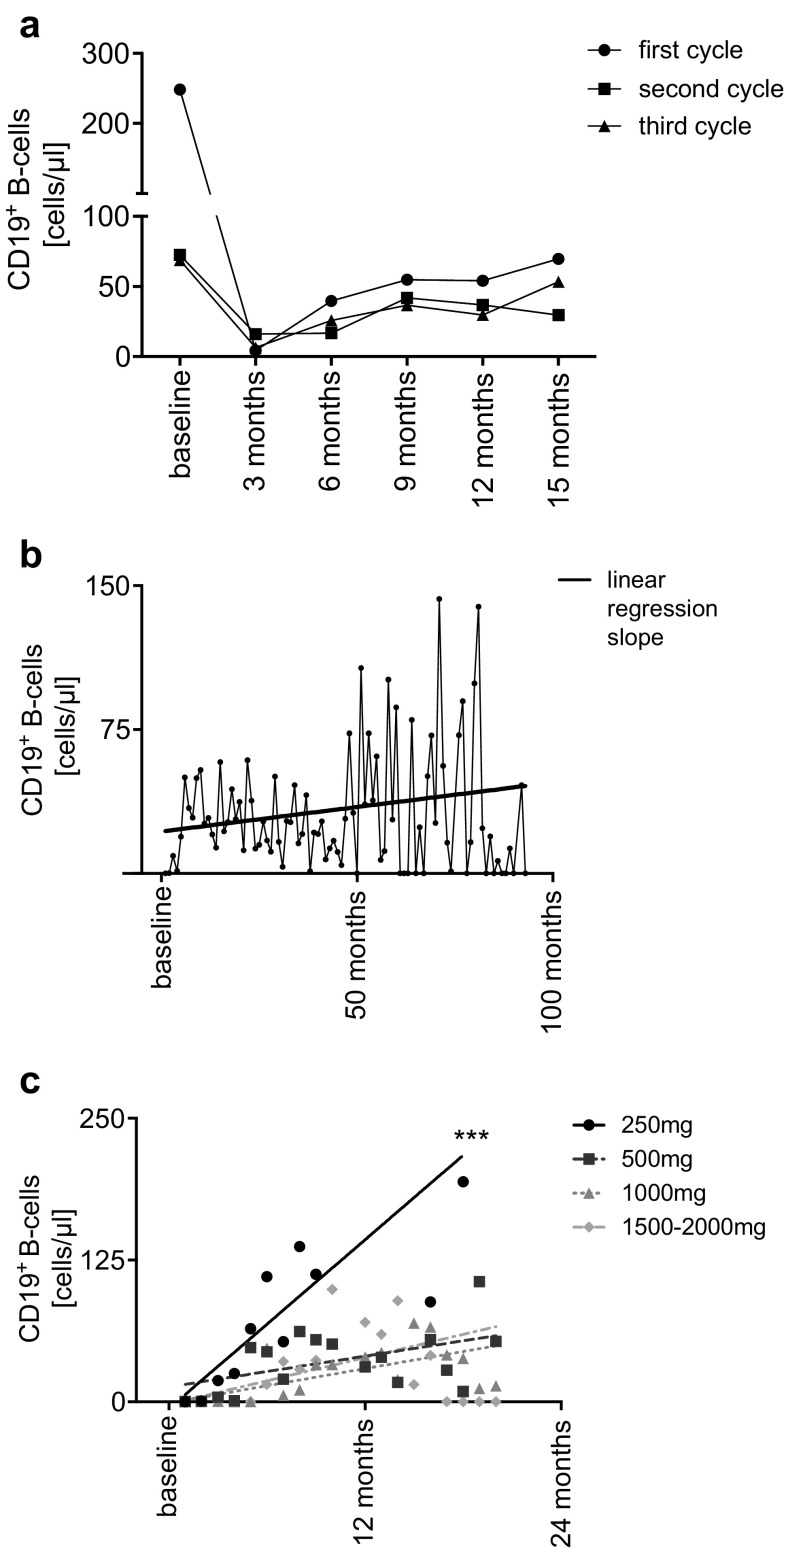
a Mean absolute cell count (cells/µl) of CD19+ B-cells over time and over multiple cycles of rituximab (RTX). Baseline represents the last available cell count before each cycle of RTX. Cell counts are summarized in 3 months intervals. b Mean absolute cell count (cells/µl) of CD19+ B-cells over time during whole follow-up after the first depletion with RTX. Linear regression slope of mean CD19+ B-cell counts during therapy. The regression slope slightly increases over time due to reconstitution of CD19+ B-cell after depletion and decreasing number of patients with redosing. For the decreasing number of patients during follow-up, the graph of mean CD19 + B-cells shows higher variance as time progresses. c Linear regression of absolute cell count (cells/µl) of CD19+ B-cells, over multiple cycles of RTX, according to applied dosage

