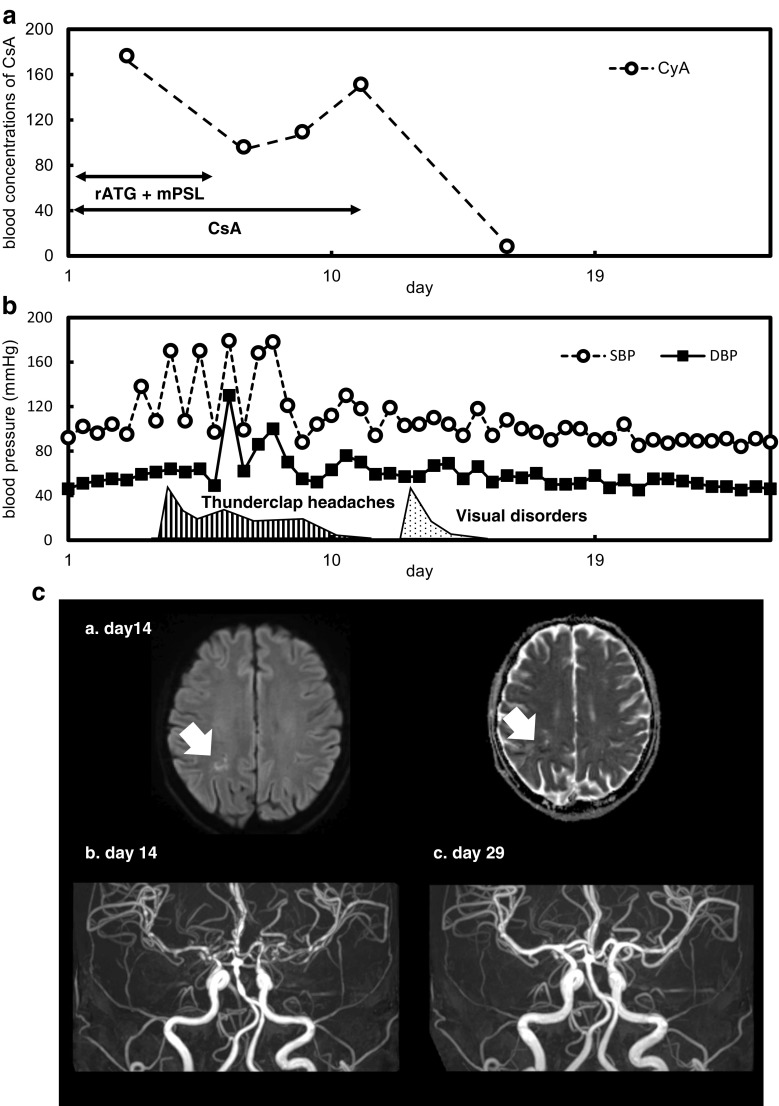
Fig. 1.
The progress of treatment, with symptoms and neuroimages. a The blood concentrations of CsA (ng/mL) and the times of prescription to treat severe AA. b Blood pressure (circles: SBP; squares: DBP; mmHg) and symptoms over time (stripes: thunderclap headaches from day 5 to 11; polka-dots: visual disorders from day 13 to 15). c (a.) The MRI DWI map (left) and the MRI ADC map (right) reveal fresh cerebral infarction of the left occipital lobe (arrows) on day 14 after treatment commenced. (b.) MRA of the arterial circle of Willis reveals segmental vasoconstrictions of the basilar artery, the anterior and posterior communicating arteries, and the anterior and middle cerebral arteries, on day 14 after treatment commenced. (c.) MRA of the arterial circle of Willis reveals diffuse improvement of vasoconstriction on day 29 after treatment commenced. CsA cyclosporine A, AA aplastic anemia, ATG anti-thymocyte globulin, mPSL methylprednisolone, SBP systolic blood pressure, DBP diastolic blood pressure, MRI magnetic resonance imaging, DWI diffusion-weighted imaging, MRA magnetic resonance angiography, ADC apparent diffusion coefficient

