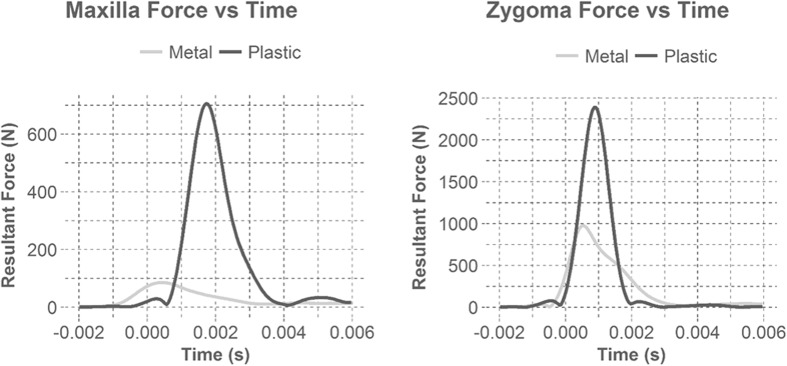
Figure 4.
Illustrates example force time plots for metal and plastic masks during maxilla and zygoma impacts. Time zero was identified when the data acquisition was triggered (> 5 g in x-axis). Plastic masks yielded over double the force than metal masks and had steeper slopes indicating a higher loading rate. The higher loading rate is a result of the ball contacting the face during impact. For most cases, the masks rested on the zygoma, aligning the forces with the onset of impact. However, most masks did not initiate contact with the maxilla until later in the impact duration, resulting in the loading differences between the maxilla and the zygoma.

