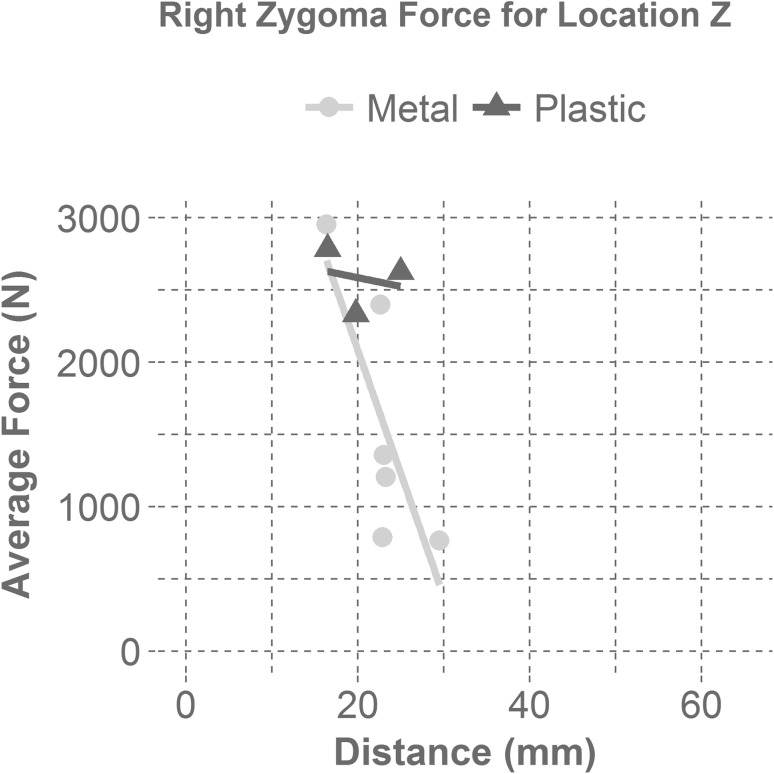
Figure 6.
Displays the average right zygoma force as a function of the distance between the mask and the zygoma for each mask material at the zygoma impact location (Z). The linear regression line for the metal masks displays a steep negative correlation with distance for a zygoma impact (Z). The linear regression line for the plastic masks shows that there is little correlation between mask distance and average force for plastic masks in zygoma impacts (Z).

