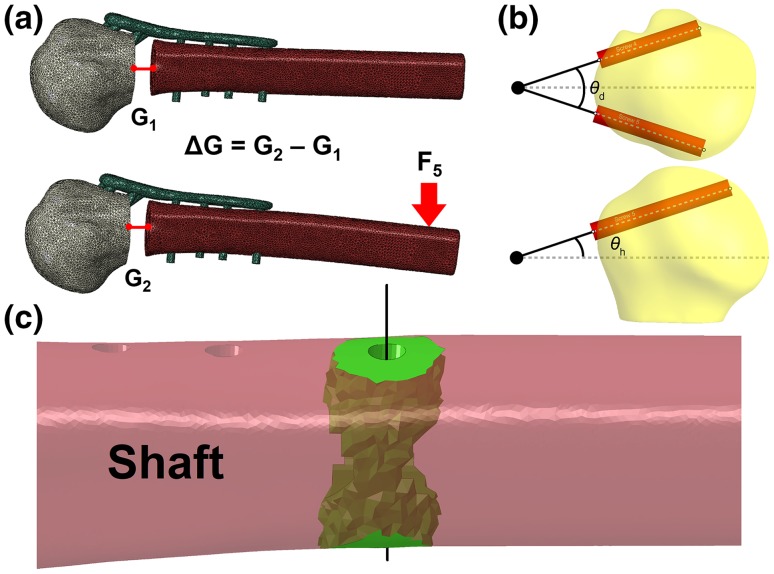
Figure 4.
Visual representation of (a) fracture gap change calculation, (b) divergence angle θd and height angle θh of screws 4 and 5, along with screws’ midpoint (large black dot) and their midline (dashed grey line) and (c) the bone region (green) surrounding screw 10’s axis (black line) selected for stress calculations.

