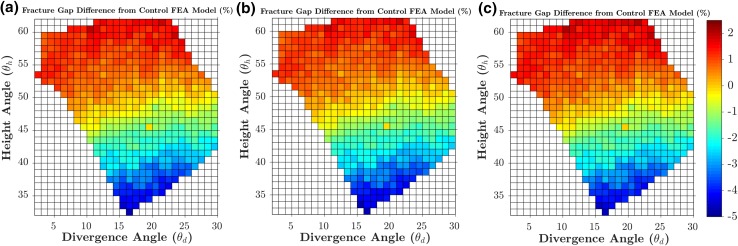
Figure 8.
Contour plots showing the percentage changes in the fracture gap change (ΔG) for each of the 538 feasible height and divergence angle combinations, when subjected to 5 mm (a), 2 mm (b) and 10 mm (c) of varus displacement. Percentage changes for each loading condition are calculated with respect to the baseline values from its standard model.

