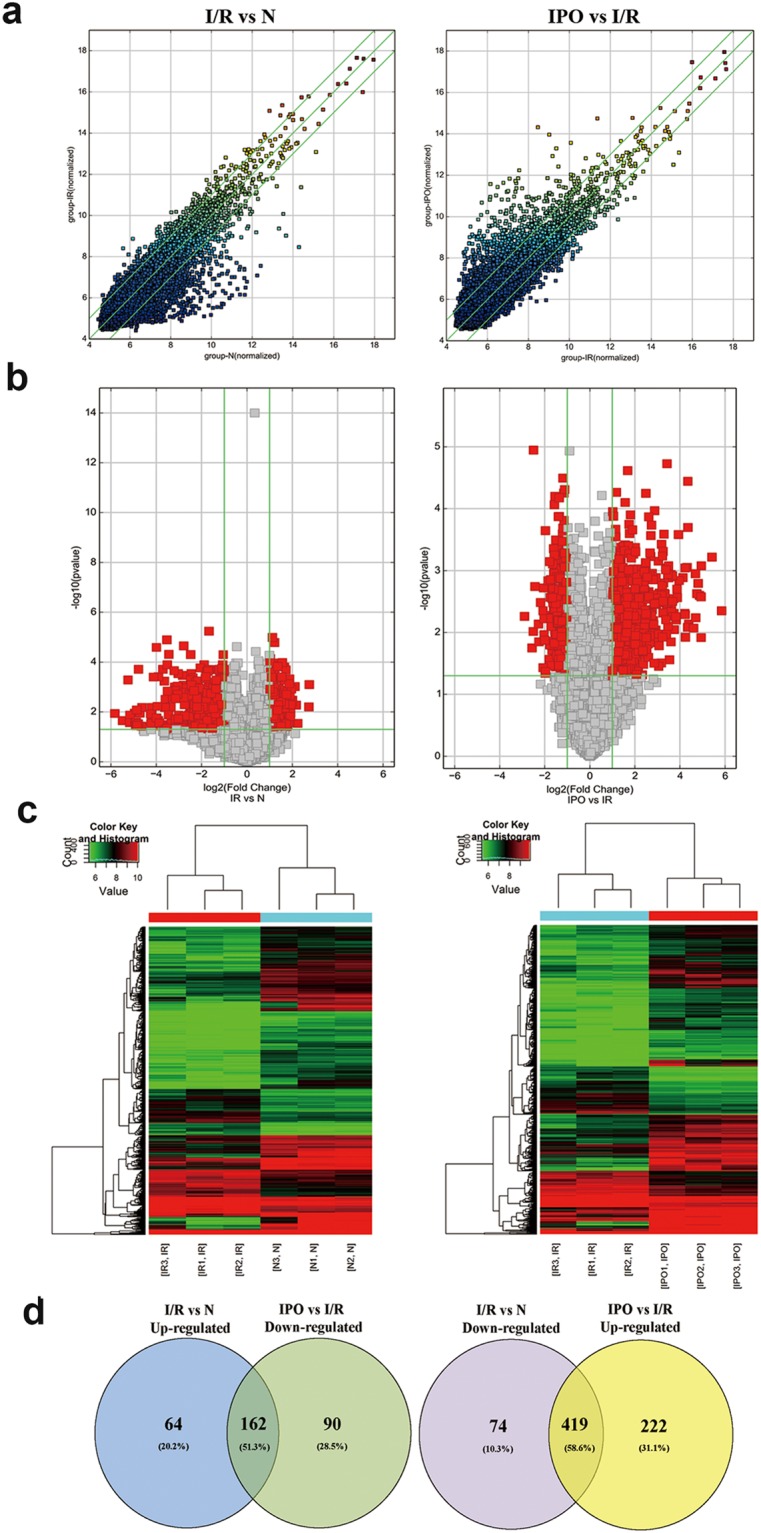
Figure 2.

Bioinformatic analysis of circRNA expression pattern during hepatic I/R injury by microarray. (a) Scatter plot analysis was conducted to exhibit the circRNA expression distribution. The green lines represent the default significant fold change (2.0). (b) A volcano graph was created to show significantly dysregulated circRNAs (fold change >2.0, p-value < 0.05). (c) Heat map evaluation of the distinguishable circRNA expression patterns among the normal, I/R, and IPO group samples. Each column represents the expression pattern of one sample, and high and low expression levels are indicated by the “red” and “green” lines, respectively. (d) Venn diagram analysis of dysregulated circRNAs indicated that most of them (51.3% and 58.6%) were sequentially expressed during IPO attenuation of I/R injury.
