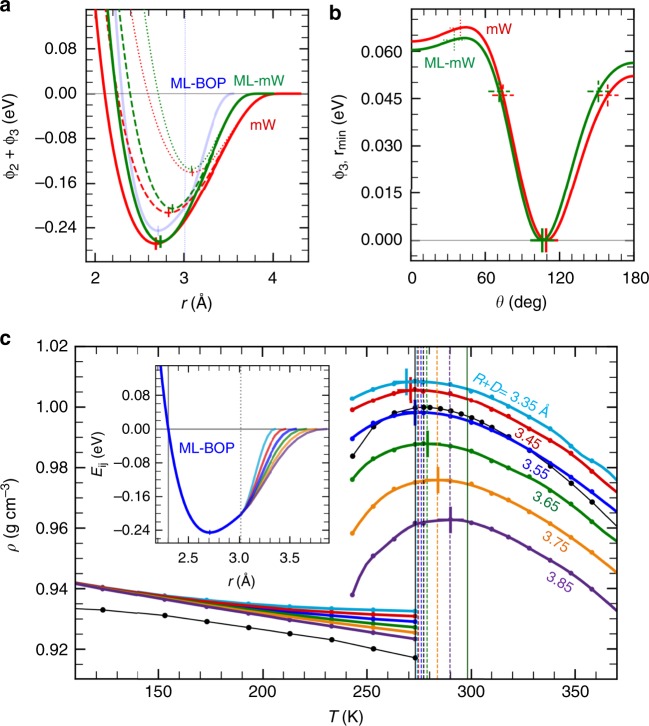
Fig. 3.
Origin of the performance improvements in the ML-mW and ML-BOP models. a Solid line style curves compare the 2-body only interaction energy of ML-mW, mW, and ML-BOP (ϕ3 = 0 for the mW models and bij = 1 for ML-BOP). The vertical dotted line marks the Tersoff cutoff switching distance (R−D) in ML-BOP. Dashed and dotted line style curves show the pair interaction energy of ML-mW and mW under the influence of a third atom, the addition of ϕ3. b 3-body energy term, ϕ3, evaluated at the minimum of the pair interaction energy curves, rmin. Note that we first identify rmin for each interatomic angle θ and then compute the corresponding ϕ3. The cross marks indicate the θ at which the interaction energy curves in (a) are evaluated. c The explicit cutoff function, fc, in Tersoff provides a flexibility to independently modify the tail portion of the pair interaction energy curve (inset). This influences the relative separation between melting point (cross marks) and TMD (vertical dotted lines) in the temperature-dependent density plot

