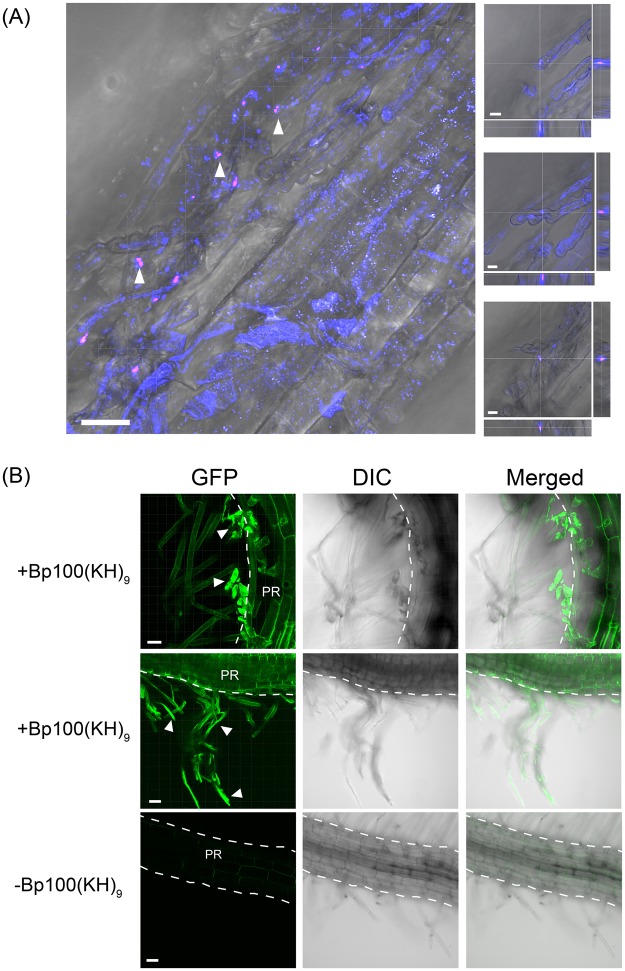
Figure 2.
Uptake of the peptide-pDNA complex and expression in N. benthamiana roots. (A) A complex consisting of Cy3-labeled pDNA (35S-Nluc-TNOS) and the fusion peptide, Bp100(KH)9 was infiltrated into 7-DAG seedlings. pDNA labeled with Cy3 is shown in magenta and the plasma membrane or vesicles stained with FM4-64 are shown in blue. The complexes were observed around the root hairs. The arrowheads indicate the regions containing the complex of Cy3-labeled pDNA (magenta). The regions indicated by the arrowheads were enlarged and obtained at different focus on the right, with the Z stack longitudinal sections on the right of the enlarged views and the transverse sections at the bottom. The CLSM observations were performed within one hour of M. Scale bars represent 30 μm on the left, 8 μm on the right. (B) GFP fluorescence (green) in N. benthamiana roots following infiltration with the peptide-based gene carrier. The upper and middle rows are samples into which a peptide-pDNA complex consisting of Bp100(KH)9 and 35S-GFP(S65T)-TNOS was infiltrated. The bottom is a sample in which only pDNA was infiltrated as a control. The white arrowheads indicate the root hair part expressing GFP. The outline of the primary root (PR) is indicated by a dotted line. Scale bars represent 30 μm.

