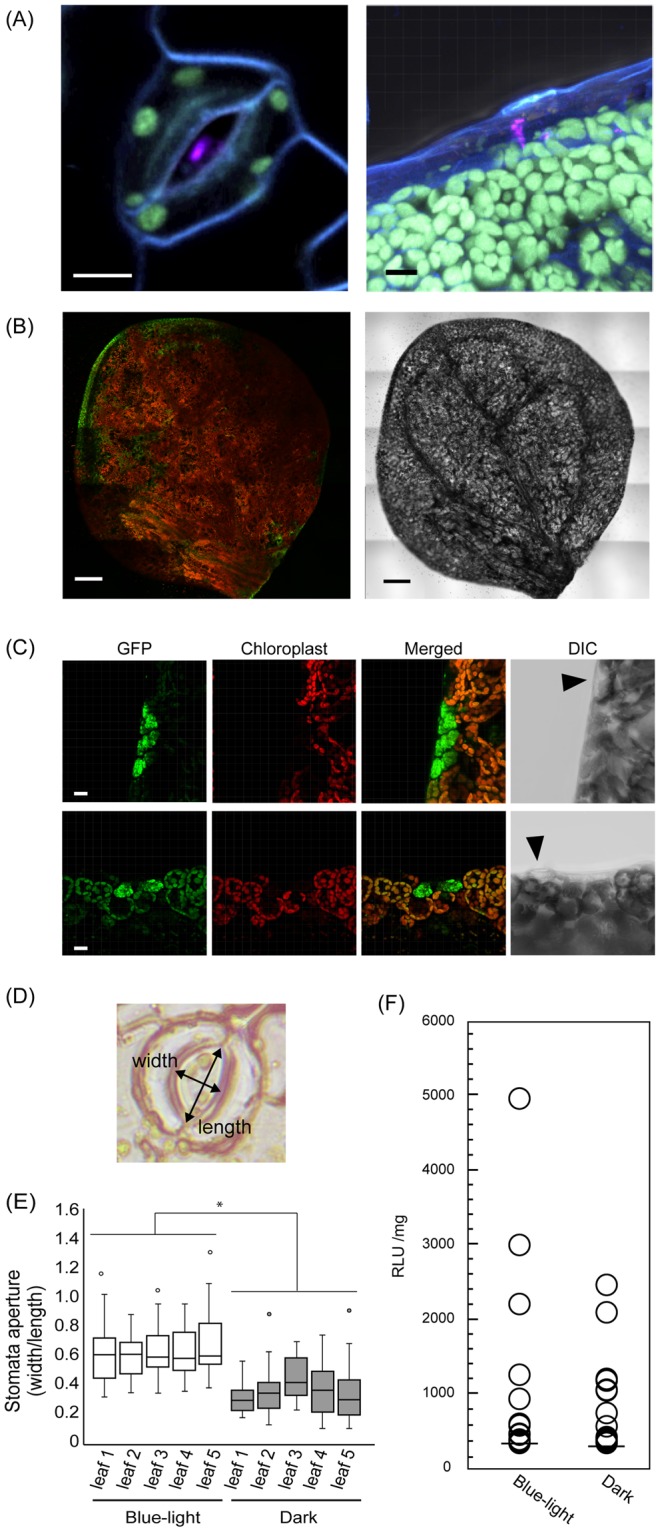
Figure 3.

Uptake of the peptide-pDNA complex and A. thaliana leaves. (A) The complex was observed in stomata (left) or hydathodes (right). Complexes consisting of Cy3-labeled pDNA (35S-Nluc-TNOS) and the fusion peptide Bp100(KH)9 were infiltrated into 7-DAG seedlings. pDNA labeled with Cy3 is shown in magenta, chloroplast autofluorescence is green, and the plasma membrane stained with FM4-64 is shown in blue. Scale bars are 10 μm. (B) The whole leaf of A. thaliana was infiltrated with the peptide-pDNA complex consisting of Bp100(KH)9 and 35S-GFP(S65T)-TNOS. CSLM was used to observe the leaves 24 h after the degassing and pressurizing treatments. GFP fluorescence (green) was mainly detected at the leaf edge (left). Red is chloroplast autofluorescence. The right image shows DIC. Scale bars are 200 μm. (C) GFP (green) fluorescence in the leaf margin of A. thaliana differs from chloroplast autofluorescence (red). The upper and lower panels are representative examples. Arrowheads in DIC indicate hydathodes. Scale bars are 15 μm. (D) Relative stomatal aperture was calculated by dividing the width of the stomatal pore by its length. (E) Relationship between the relative stomatal apertures of A. thaliana seedlings caused by different light conditions (blue light or darkness) and the efficiency of peptide-pDNA complex penetration into the leaf. Box plots show the median and 25th and 75th percentiles; whiskers represent confidence intervals, and open circles indicate outliers (n = 30, *p < 0.05, t-test, mean ± SD). (F) An Nluc assay performed under the two light conditions using 14-DAG A. thaliana seedlings. Total proteins were extracted from the shoots only (n = 56, p = 0.821, Mann-Whitney U test).
