
Figure 2.
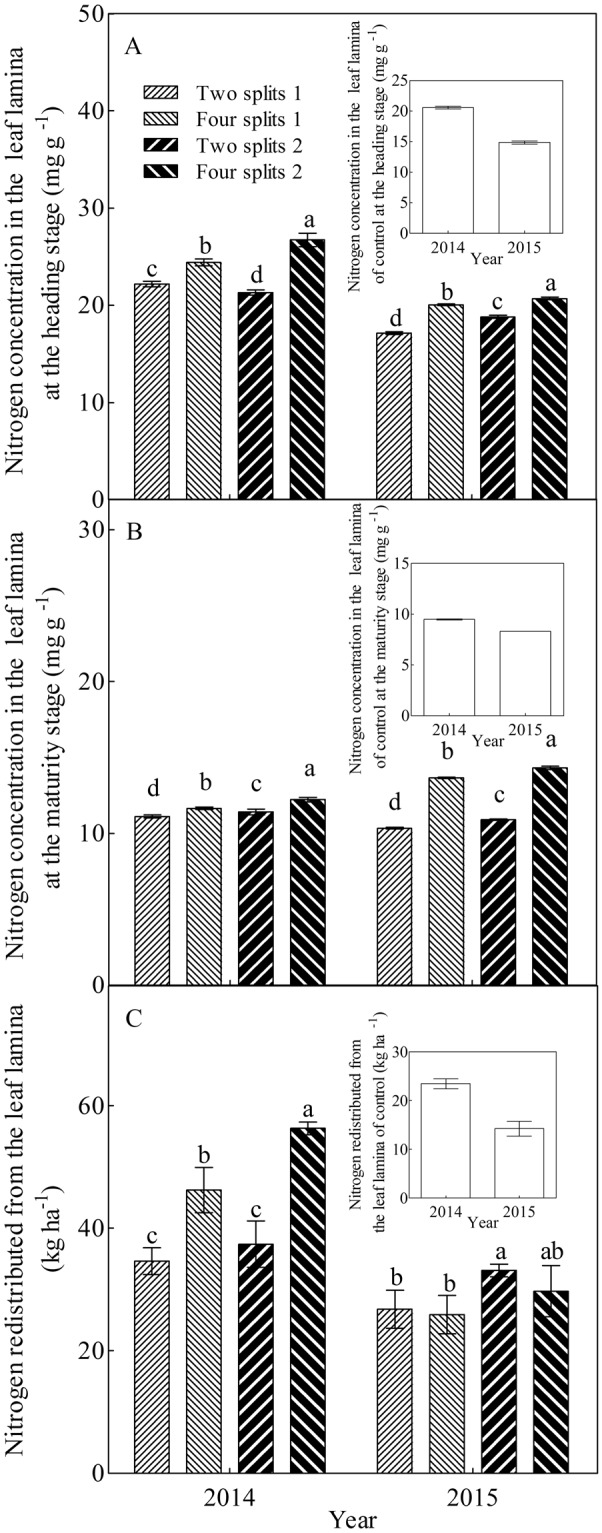
Nitrogen concentration in the leaf lamina at the heading stage (A) and maturity stage (B), and the nitrogen redistributed from the leaf lamina (C) in response to year, urea type, and N management. Different lowercase letters within a group of treatment represent significant (P < 0.05) differences among treatments. The control was not included in the analysis of variance and multiple comparisons. The bar with each column indicates the range of the standard error (SE) of the mean.