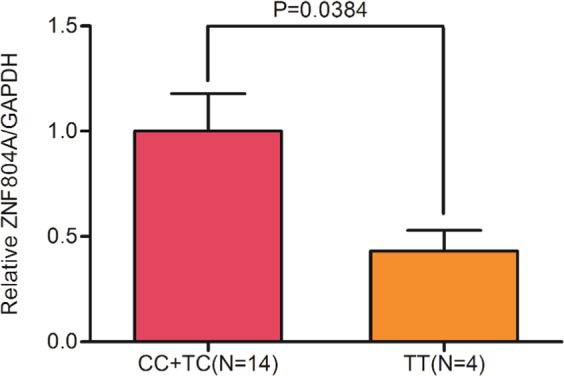
Fig. 1. Quantitative real-time PCR analysis of the ZNF804A mRNA level in 18 brain tissue samples with different genotypes of rs10497655.

All values were transformed with the level of human GAPDH mRNA as a reference before the analysis and then the data were normalized to the CC + TC group. The values for the groups are as follows: 1.0000 ± 0.1777 in group CC + TC and 0.4305 ± 0.0985 in group TT. The significance between the two groups was P = 0.0384, which was the result from the Mann–Whitney U-test conducted by GraphPad Prism. The data shown are described as the mean ± SE of at least four independent experiments
