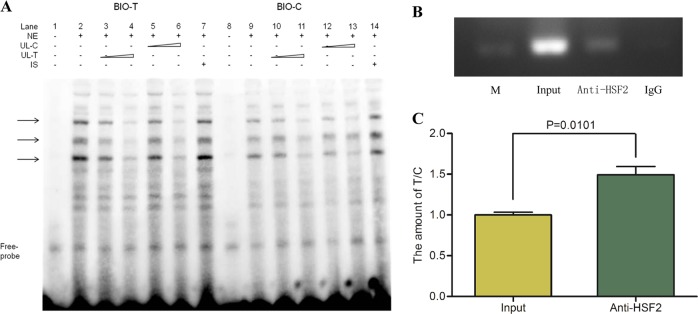
Fig. 2.
a The difference in the combining capacity with HEK-293T nuclear proteins in the T and C allele probes shown in EMSA. Lanes 1–7: biotin-labeled probe containing the T allele plus HEK-293T nuclear extract, except for lane 1; lanes 8–14: biotin-labeled probe containing the C allele and nuclear proteins, except for lane 8; NE represents nuclear proteins isolated from HEK-293T cells; UL-C/T represents unlabeled C/T probes; IS represents the unlabeled probe with an irrelevant sequence. From lane 3 to 4, 5 to 6, 10 to 11, and 12 to 13, 5- to 50-fold excesses of the corresponding unlabeled probes were used. b Chromatin immunoprecipitation (ChIP) assays in IMR-32 cells with the specific antibody to the predicted transcription factor HSF2. The in vivo binding of the HSF2 protein to the rs10497655 position was verified with polymerase chain reaction (PCR). M indicates the 250-bp band of DNA markers; the other three lanes are products from PCR with the ChIP input, DNA precipitated by anti-HSF2 and DNA by IgG as templates. c The amounts of the T/C alleles were quantified by SNaPshot from the ChIP input and products treated anti-HSF2. The ratio of the T allele to the C in the DNA immunoprecipitated (1.4926 ± 0.1016) was higher than that in the input DNA (1.0000 ± 0.0346), and the difference reached statistical significance. All values were normalized to the input levels. Significance between two groups was P = 0.0101 < 0.05, which was the result from unpaired Student’s t-test performed by GraphPad Prism. Data shown are mean ± SE from three independent assays

