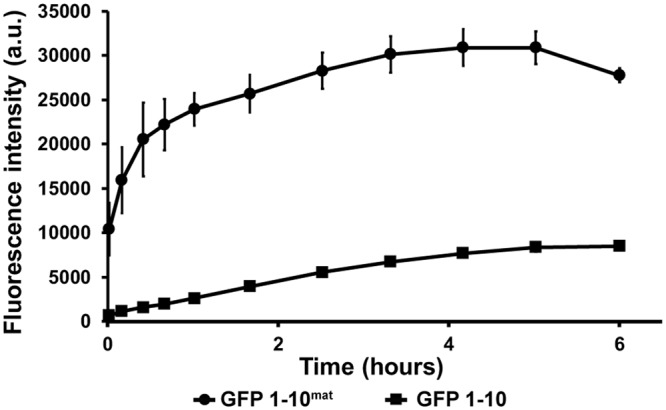
Figure 3.

Comparison of the kinetics of fluorescent signal generation using GFP 1–10mat and GFP 1–10. GFP 1–10mat and GFP 1–10 were compared head-to-head in TNG buffer containing His6-Z_-GFP 11. His6-Z_GFP 11 was excluded in negative controls and the fluorescence from these controls were subtracted from the actual samples. Supplementary Fig. S7 presents a plot with raw data for samples and negative controls. After only two minutes (the first datapoint), the signal from GFP 1–10mat had increased by more than 10,000 a.u. (83 a.u./sec) while the GFP 1–10 steadily increased with only 0.5 a.u./sec until its maximum., thereby making the mature version up to 150-fold faster. Furthermore, the GFP 1–10mat presented a final signal almost four times greater than observed for the GFP 1–10.
