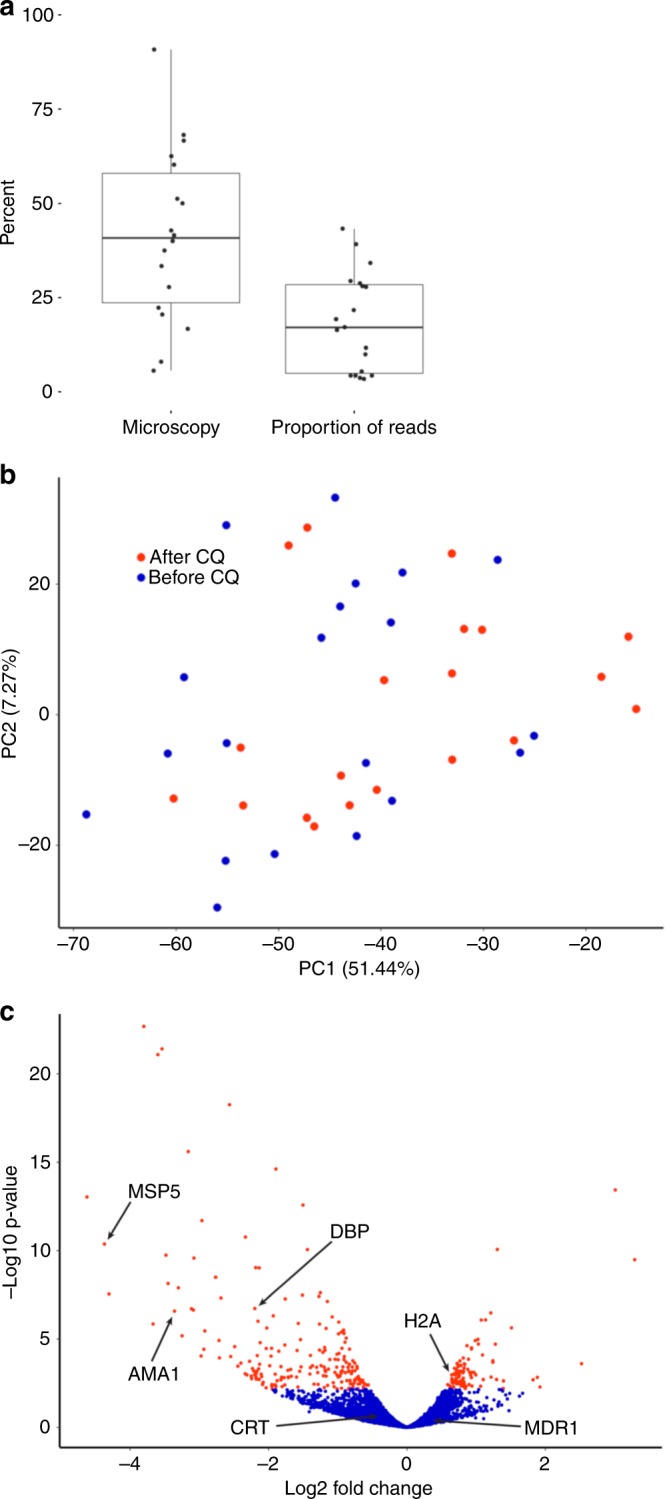
Fig. 3.

Effect of chloroquine on parasite gene expression. a Decrease in the number of parasites 8 h after chloroquine administration (represented by the proportion of remaining parasites, in %) measured by microscopy and by the proportion of parasite reads. Each dot represents one infection, the centerline shows the median, the box limits the quartiles, and the whiskers indicate the range (with outliers removed). b Principal component analysis of the parasite gene expression profiles from each sample before (blue dots) and 8 h after chloroquine administration (red dots). c Volcano plot of the gene expression changes after chloroquine treatment. Each dot represents one annotated P. vivax gene and is displayed according to the fold-change in expression (x-axis, in log2) and statistical significance (y-axis, in negative logarithm to the base 10 of the p-value). Red indicates significantly affected genes (FDR < 0.1)
