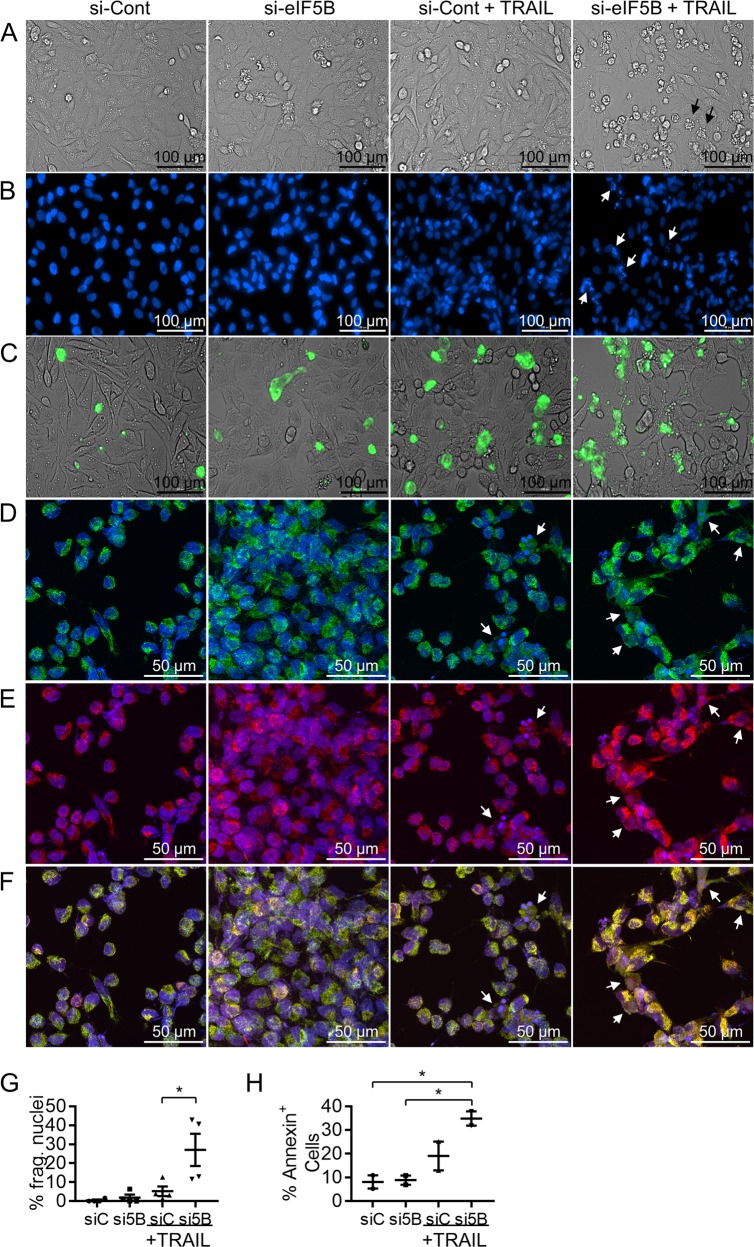
Fig. 2. Depletion of eIF5B enhances TRAIL-induced apoptotic cell behavior.
U343 cells were treated as in Fig. 1, except that TRAIL treatment was limited to the last 4 h. Cells in a were imaged at × 20 magnification by brightfield microscopy. Cells in b, c were, respectively, imaged by fluorescence microscopy to analyze Hoechst-stained nuclear DNA (blue) or Annexin V-FITC-positive cells (green). Alternatively, the cells in d–f were analyzed by confocal microscopy at × 40 magnification, using immunocytochemistry to assess the sub-cellular localization of cytochrome c. d Cyt C (green) with a Hoechst DNA counterstain (blue). e MitoTracker Red with Hoechst counterstain. f Overlay of images from d, e. The black arrows in a indicate examples of cells apparently undergoing apoptosis. The white arrows in b indicate examples of nuclear fragmentation. The white arrows in d–f indicate examples of apparently disrupted mitochondria. The percent of Hoechst-stained nuclei from b displaying fragmentation (white arrows) were quantified g, as were the percent of annexin-positive cells (green) from c h. Data are expressed as scatter plots, with horizontal bars representing the mean and error bars indicating the SEM for four g or two h biological replicates. *, p < 0.05

