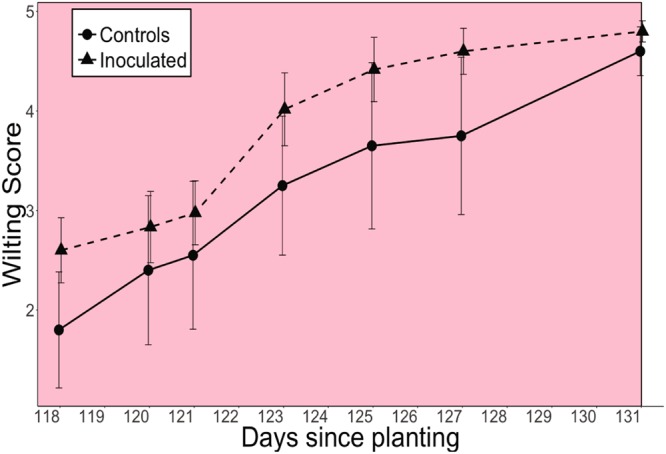
Figure 4.

Wilting score of control and inoculated groups. All values are expressed as means ± SE. The pink background color indicates the severe drought period after soil moisture declined to zero (days 118–131). Mean wilting score of the inoculated group during the entire severe drought period after soil moisture declined to zero (days 118–131, pink background) was marginally significantly greater than that of controls (P = 0.058).
