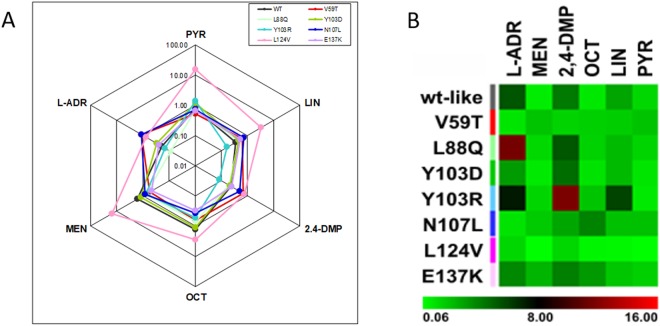
Figure 5.
In vitro binding analysis. (A) Radar plot of the binding profile for displacement of the fluorescent ligand 1-NPN from MUP mutants. The equilibrium association constants, Ka, relative to the binding of each ligand to each mutant MUP are plotted on a logarithmic scale. (B) The equilibrium dissociation constants, Kd, are plotted as a heatmap, displaying the variations across mutants, and between different ligands binding to the same mutant. The change of Kd values are represented from light green to light red and the numbers refer to the range of dissociation constants (µM).

