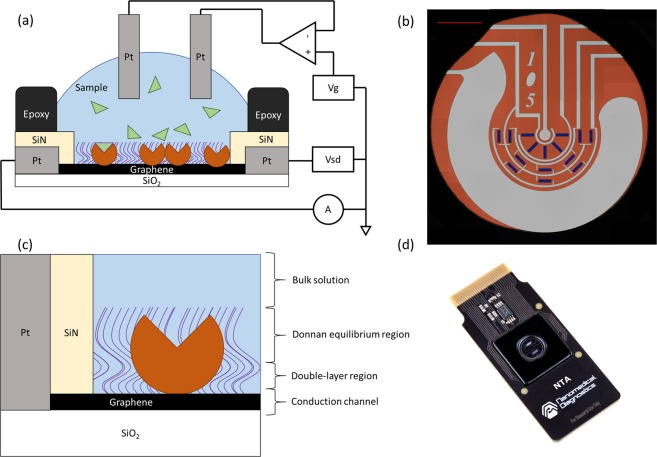
Figure 1.
(a) Diagram of the sensor architecture. Circular sections on top of the graphene represent proteins embedded in a blocking layer, represented by curved lines. (b) A microscopy image showing an entire sensor surface. Red scalebar is 1 mm. There are fifteen graphene strips grouped into three groups of five, exposed through the silicon nitride protective layer. The center of the circuit is the gate measurement pad (pseudo-reference) and the large pad surrounding the graphene strips is the liquid gate (counter electrode). (c) Diagram of the sensor regions near the graphene. The double layer region is 0.3/ nm tall, where is the ionic strength of the bulk solution. The Donnan equilibrium region is the thickness of the combined protein and blocking layer on the surface. (d) Picture of the complete biosensor.

