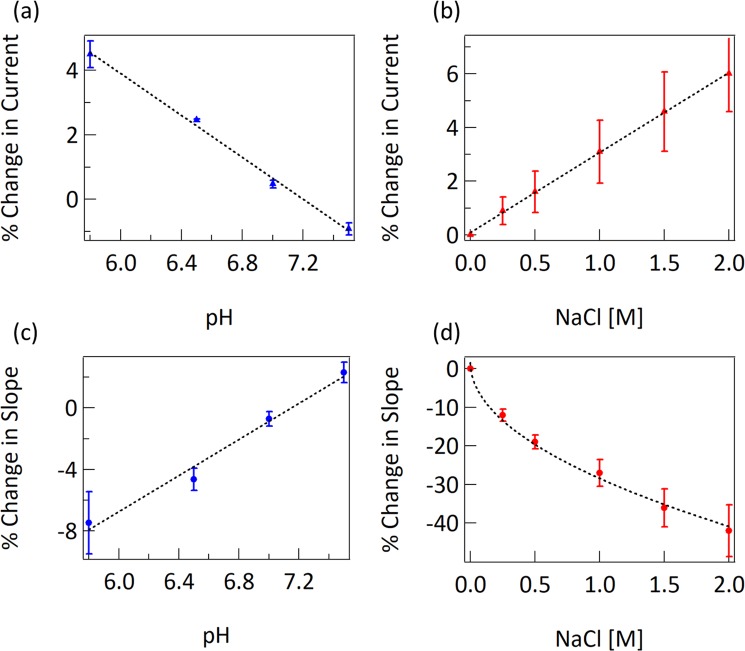
Figure 2.
(a) Change in current due to change in pH. Fit is linear with a slope of −3.2% per pH unit. (b) Change in current due to change in ionic strength, when pH is held constant. Fit is linear with a slope of 3.0% per molar unit of NaCl. (c) Change in slope (dI/dVg) due to change in pH. Fit is linear with a slope of 5.9% per pH unit. (d) Change in slope due to change in ionic strength. Response is fit to −0.3 . Each datapoint in this figure is an average of data from four sensor chips.

