Figure 1.
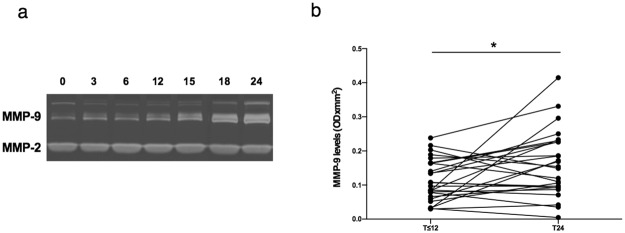
MMP-9 levels in plasma samples from RRMS patients according to natalizumab infusion number. MMP-9 plasma levels were assessed by zymography in 116 plasma samples from 34 RRMS patients under natalizumab treatment. Representative zymographic gel. MMP‐2 and MMP‐9 were identified by their apparent molecular mass of 67 and 92 kDa, respectively. The zymographic gel represents MMP-9 and MMP-2 plasma level analysis of samples from the same patient: starting from the first left lane, plasma samples collected at 0, 3, 6, 12, 15, 18 and 24 natalizumab infusions are represented, respectively. The gel represents the grouping of lanes cropped from different parts of the same gel (a). The full-length gel is included in the Supplementary Fig. S1a. Longitudinal analyses of plasma samples collected from 26 RRMS patients within 12 (T ≤ 12) and at 24 (T24) natalizumab infusions, after quantitation of MMP‐2 and MMP‐9 levels through scanning densitometry and computerize analysis of zymographic gels. For T ≤ 12 group, all samples collected at T0 (before first natalizumab infusion) were included in the analysis. When a T0 sample was not available, the first sample collected within 12 natalizumab infusions was considered. IQR: interquartile range. MMP-9 median level [IQR]: 0.10 [0.06–0.16] for T ≤ 12 and 0.15 [0.09–0.23] for T24. *p < 0.05 (Wilcoxon test) (b).

