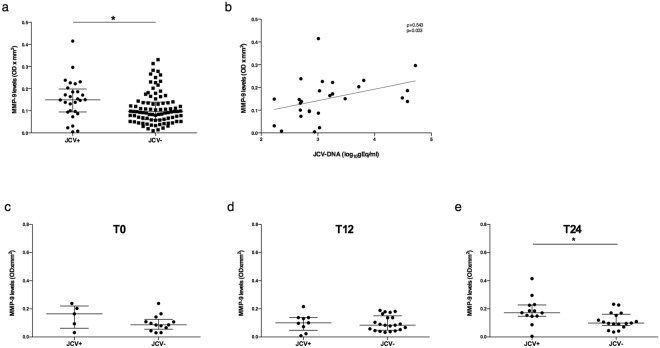
Figure 3.
MMP-9 plasma levels in JCV-DNA positive and negative samples and correlation to JCV viral load. MMP-9 plasma levels detected in 116 samples from 34 RRMS patients were higher in the JCV-DNA positive (JCV+) (n = 28) than JCV-DNA negative (JCV−) (n = 88) samples. Data are shown as median (lines) and interquartile ranges (whiskers). OD: optical density (a). MMP-9 plasma levels were positively correlated to JCV viral load in JCV+ samples (n = 28). Correlation was performed using Spearman test (Spearman coefficient [ρ] and statistical significance [p] are reported in the graphics). Linear correlation was evaluated by using the regression test, R2 = 0.156, p = 0.037 (b). Samples (n = 78) were stratified into three groups: T0 (before the first natalizumab infusion) (n = 18); T12 (within the first year of treatment) (n = 30); T24 (during the second year of treatment) (n = 30). No differences were found in MMP-9 plasma levels comparing JCV+ and JCV− samples at T0 (c) and T12 (d). MMP-9 levels resulted increased in JCV+ compared to JCV− samples for T24 group (e). Data are shown as median (lines) and interquartile range (whiskers). JCV+: JCV-DNA positive samples, JCV−: JCV-DNA negative samples. *p < 0.05 (Wilcoxon test).

