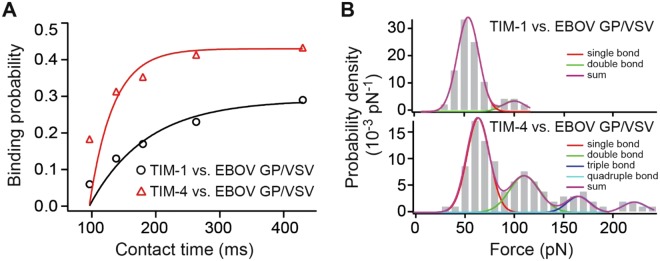
Figure 3.
On-rate measurements. (A) The binding probabilities (P) of TIM-1–EBOV GP/VSV and TIM-4–EBOV GP/VSV interactions are plotted as a function of the contact time (t). The solid line is the result of least-squares fits of equation P = A(1 − (1−exp(−(t − t0)/τ)), where A and t0 are the maximal observed binding probability and the shortest contact time tested, respectively. The binding time constant is τ. Equation kon = 1/(τCeff) was used to estimation the on-rates. (B) Unbinding force distributions of TIM-1–EBOV GP/VSV (upper panel) and TIM-4–EBOV GP/VSV (lower panel) interactions at 430 ms contact time. Multiple-peak Gaussians were fitted to the curves. Each Gaussian peak and the sum of fitted Gaussians are overlaid on the distribution curve.

