Figure 7.
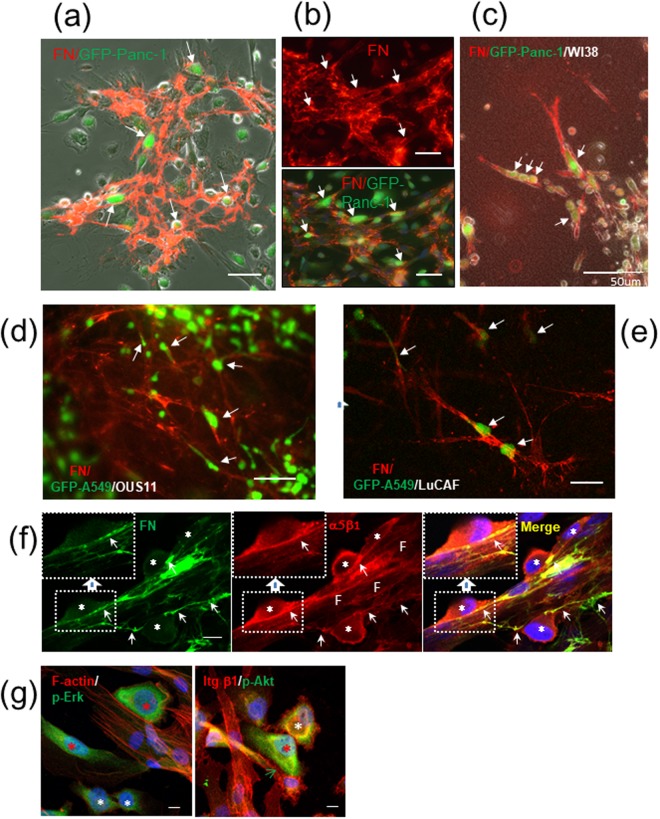
Cancer cells adhere to fibroblasts with fibronectin (FN) deposits and become activated. (a,b) Immunofluorescent (IF) staining for FN (red) on WI-38 cells in 2D co-cultures. Arrows point Panc-1 cells (green) attaching to fibroblasts. Scale bars, 50 μm. (a) A phase-contrast image with FN signals. (b) IF image of FN fibrils (upper panel) and its merged image with GFP (Panc-1) (lower panel). Scale bars, 100 μm. (c–e) Cancer cell (green) invasion in contact with fibroblast protrusions with FN deposits (red) in 3D collagen gel: GFP-Panc-1/WI-38 (c), GFP-A549/OUS-11 (d), and GFP-A549/LuCAF (e). (f) Co-localization of integrin α5β1 (red) with FN fibrils (green) at non-labeled Panc-1/WI-38 contact sites (arrows) in 2D co-culture. Blue, DAPI stain; asterisks, Panc-1 cells; F, fibroblasts. Insets, magnified views of the indicated boxed areas. Scale bars, 10 μm. (g) IF staining of Panc-1/WI-38 co-culture for phosphorylated Erk (p-Erk, green) and F-actin (red) in the left panel and for phosphorylated Akt (p-Akt, green) and integrin β1 (red) in the right panel. Red asterisks, fibroblast-bound, activated cancer cells; white asterisks, unbound cancer cells; green arrow, positive signals in cancer cells for integrin β1 at the heterotypic contact site. When the p-Erk and p-Akt signals were quantitated using the NIH image J software, the relative intensity for the cellular p-Erk signal was 100 and 70 (85 in average) in the red asterisks and 58 and 35 (47 in average) in the white ones, while that for p-Akt was 100 (red asterisk) and 64 (white asterisk).

