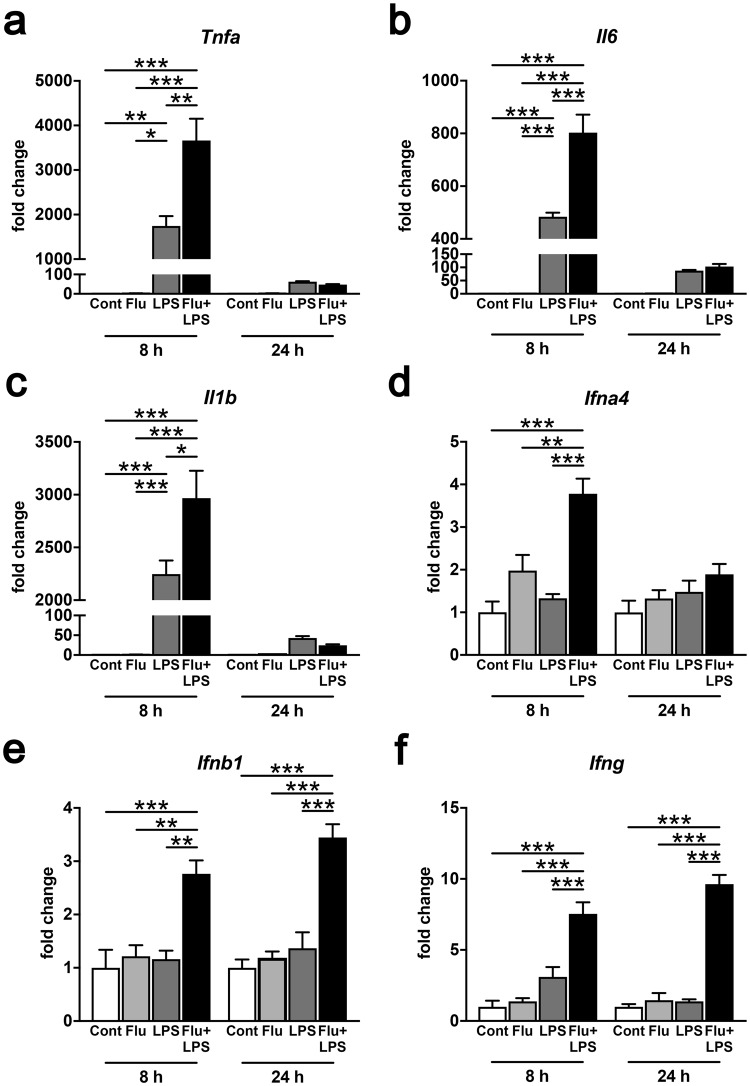
Figure 2.
Levels of inflammatory cytokines and IFNs in IAE model mice. Gene expressions of Tnfa (a), Il6 (b), Il1b (c), Ifna4 (d), Ifnb1 (e), and Ifng (f) from whole brains at 8 h and 24 h post LPS administration were analysed by quantitative PCR. Data are shown as the mean ± SEM (8 h control, n = 5; Flu, n = 3; LPS, n = 5; Flu + LPS, n = 5; 24 h control, n = 5; Flu, n = 5; LPS, n = 3; Flu + LPS, n = 6) and are from a representative experiment of two or three independent experiments. *p < 0.05; **p < 0.01; ***p < 0.001.

