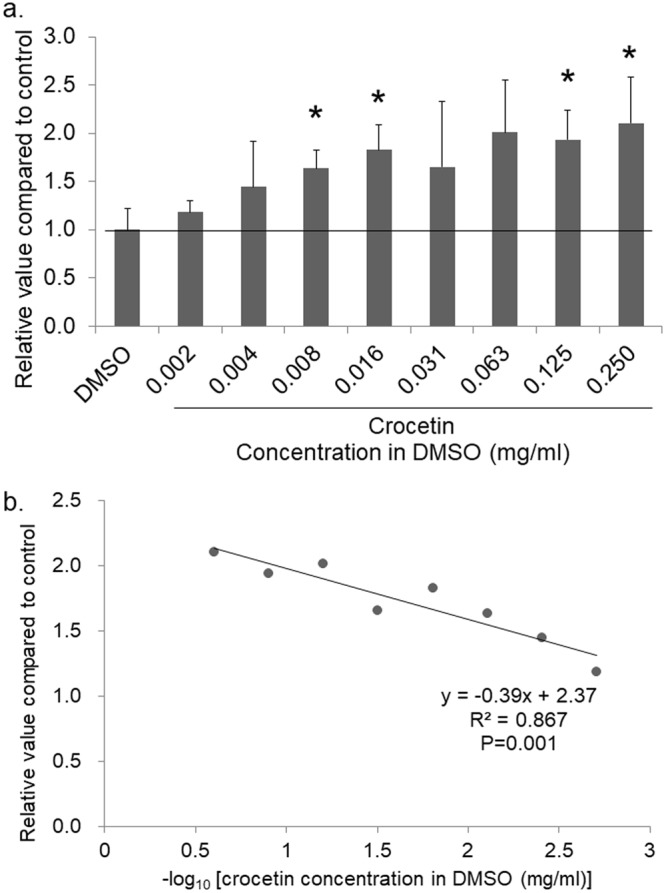
Figure 1.

Comparison of relative values of Egr-1 activation at various concentrations of crocetin in vitro. (a) The assay of crocetin was repeated with various concentrations. Note that a statistically significant increase of Egr-1 activation was observed at least with 0.008 mg/ml. *p < 0.05. Bars represent mean +/− standard deviations. (b) Log-linear analysis revealed a significant linear correlation between the concentration of crocetin and the relative value of Egr-1 activation compared to control. X-axis is negative common logarithm of crocetin concentration in DMSO (mg/ml).
