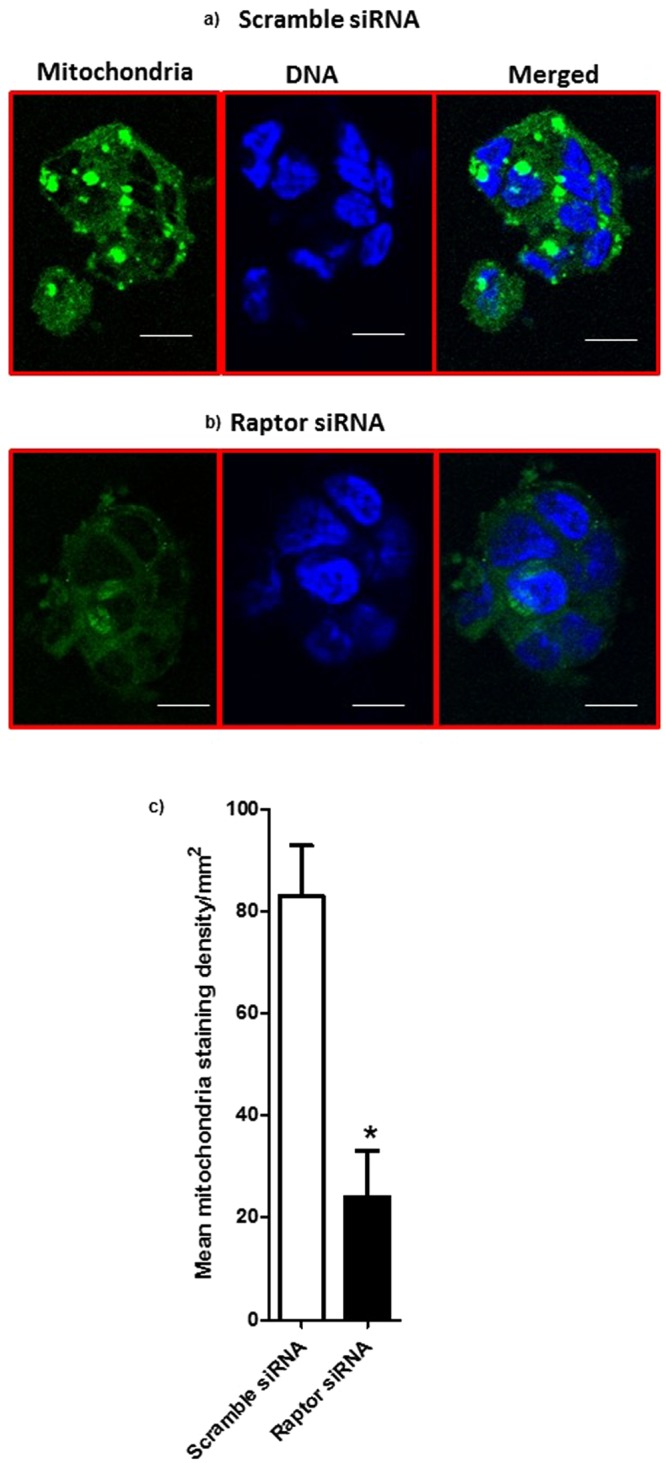
Figure 6.

Visualization of mitochondria in PHT cells using immunofluorescence. Trophoblast cells were transfected at 18 h in culture with scramble (a) or raptor (b) siRNA. At 90 h in culture, cells were incubated with mitochondrial dye and fixed and mitochondria (green) were visualized using immunofluorescence. The data are from a representative experiment, and similar results were obtained from three other experiments. Nuclei were counterstained using DAPI (4′,6-diamidino-2-phenylindole) (blue); scale bar 50 µm. (c) Histogram summarizes the syncytiotrophoblast mitochondrial staining intensity in PHT cells transfected with either scramble or raptor siRNA. In each section, at least five randomly selected microscopic fields were used to calculate staining density per mm2 using Image J and data were averaged to represent a single placenta. Values are given as mean + SEM; *P < 0.05 vs scramble siRNA; unpaired Student’s t-test; n = 4 placenta/each group.
