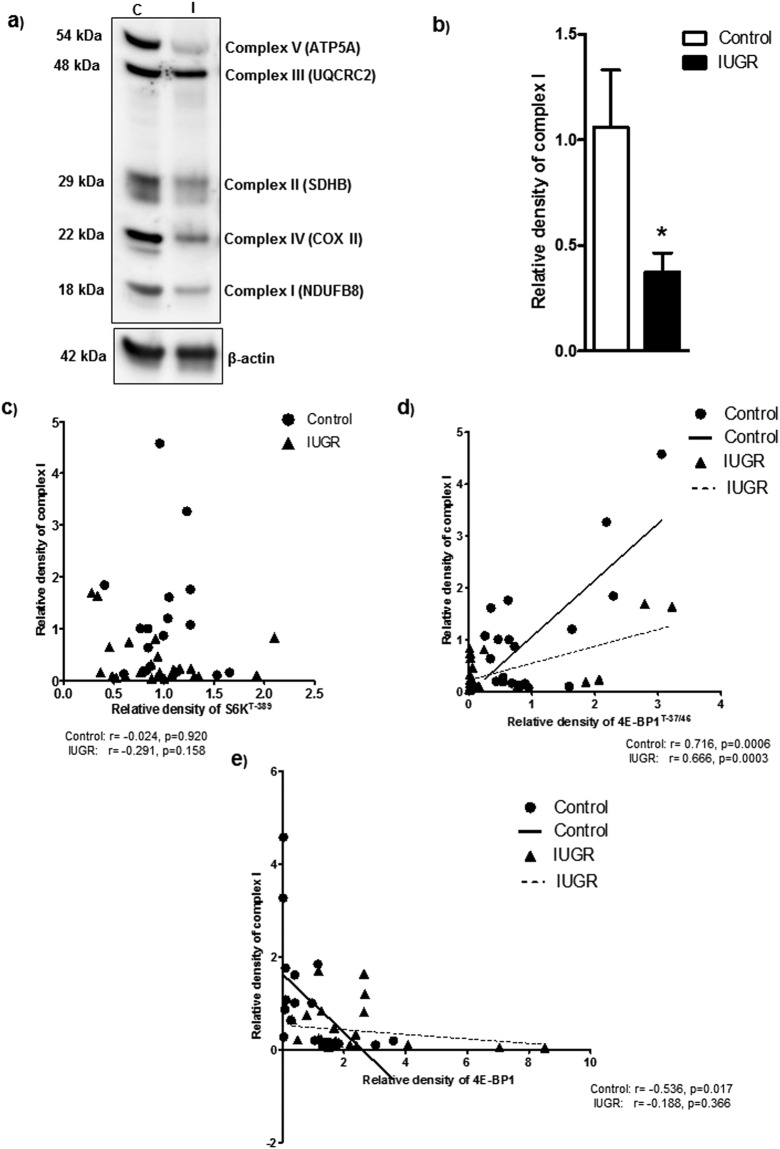
Figure 7.
Correlation between placental mTORC1 functional readouts and protein expression of mitochondrial ETC complex I. (a) Protein expression of mitochondrial electron transport chain complexes in placental homogenates of control and IUGR group. Representative Full length Western blot is shown. (b) Relative expression of mitochondrial electron transport chain complex I expression in placental homogenates of control and IUGR. After normalization to β-actin, the mean density of C samples was assigned an arbitrary value of 1. Subsequently, individual IUGR density values were expressed relative to this mean. (c–e) Correlation between placental mTORC1 functional readouts S6KT-389 (c), 4E-BP1 T-37/46 (d) 4E-BP1 (e) and mitochondrial ETC complex I expression. r = Pearson correlation coefficient, n = Control, 19; IUGR, 25. Values are given as means ± S.E.M.; *P < 0.05 vs. control; unpaired Student’s t test.

