
Fig. 7. Differentially expressed genes in EµMyc/Casp2−/− tumors associated with cancer progression.
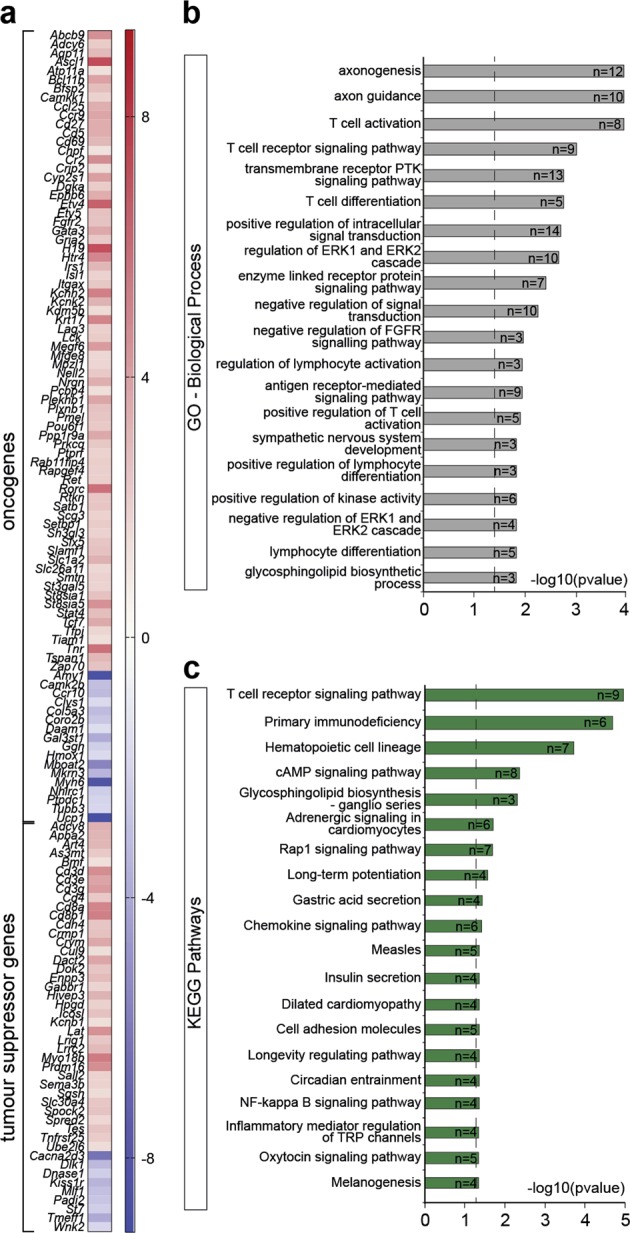
a Heat-map illustrating the increase (red) and decrease (blue) in expression (log2-fold change) of various cancer-associated genes in EµMyc/Casp2−/− tumors. b Gene Ontology annotation analysis of the top 20 significantly enriched biological processes (Benjamini adjusted P < 0.05), associated with the genes listed in (a), that show changes in gene expression (FDR < 0.1) (n = 147). The number of genes associated with each biological process is indicated. Complete gene ontology lists are provided in Supplementary Table S8c. c Pathway enrichment analysis (KEGG and REACTOME), of the cancer-associated genes differentially expressed in EµMyc/Casp2−/− tumors (n = 147). The top 20 enriched pathways are shown. Complete enriched pathway lists are provided in Supplementary Table S8d. The genes associated with each pathway are indicated. Dotted line indicates significance cut off (-log10(P-value), Benjamini corrected)