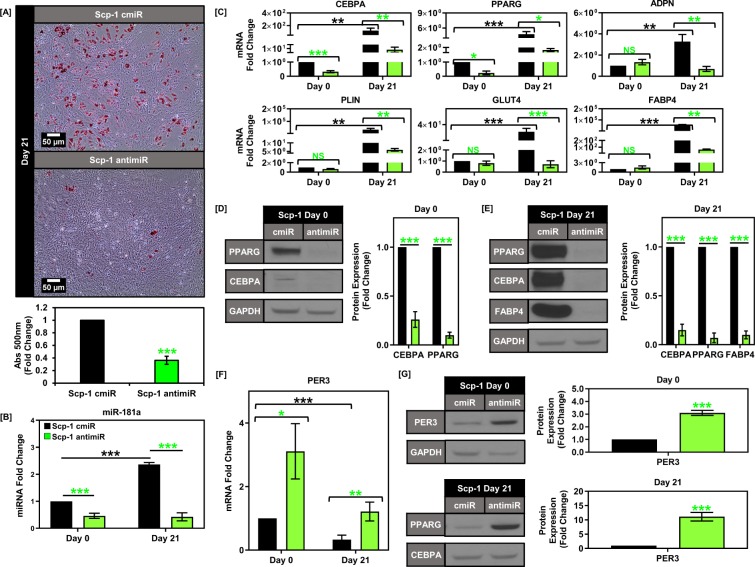
Figure 5.
Knockdown of endogenous miR-181a inhibits adipogenesis in BM-MSCs. (A) Graph showing miR-181a levels at days 0 and 21 of adipogenic differentiation for Scp-1 cells overexpressing either control vector (cmiR) or miR-181a specific antagomiR (antimiR). (B) Oil red O staining images of Scp-1 cmiR and antimiR cells on day 21 of adipogenic differentiation with representative micrographs (top) and quantification of Oil red O staining (bottom). (C) Graphs depicting decreased mRNA expression of PPARG and CEBPA at day 0 and decreased expression of adipogenesis target genes at day 21 in Scp-1 antimiR vs cmiR cells. (D) Representative western blot images showing decreased expression of CEBPA and PPARG in Scp-1 antimiR vs cmiR cells at day 0 with quantification (right) (Full blots are shown in Supplemental Fig. 9A). (E) Representative western blot images showing decreased expression of CEBPA, PPARG, and FABP4 at day 21 in Scp-1 antimiR vs cmiR cells with quantification (right) (Full blots are shown in Supplemental Fig. 9B). (F) Graph showing PER3 mRNA levels at days 0 and 21 of adipogenic differentiation in Scp-1 cmiR and antimiR cells. (G) Western blot showing PER3 protein levels at days 0 and 21 of adipogenic differentiation in Scp-1 cmiR and antimiR cells (Full blots are shown in Supplemental Fig. 9C,D). Data are representative of 3 independent experiments. * is p ≤ 0.05, ** is p ≤ 0.005, *** is p ≤ 0.0005.

