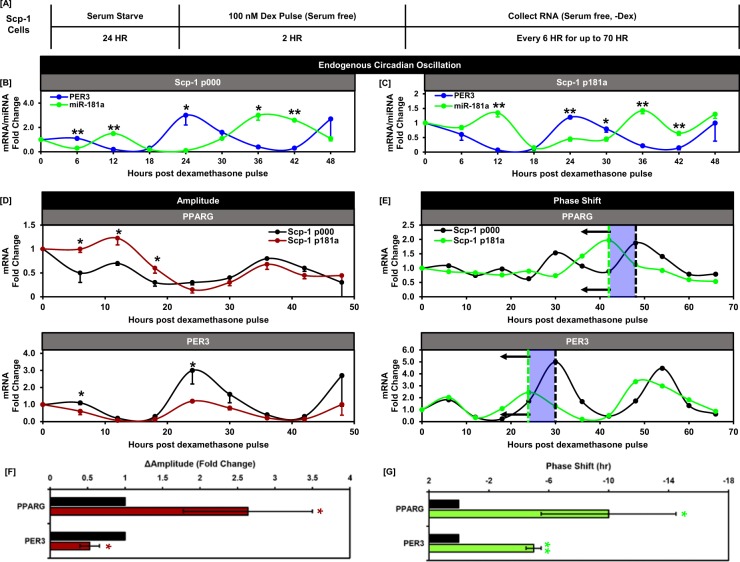
Figure 6.
miR-181a and PER3 are regulated in a circadian manner in BM-MSCs. (A) Diagram depicting the process of cell synchronization and induction of circadian oscillation using glucocorticoid stimulation. (B) Graph depicting the antiphase circadian expression patterns of miR-181a and PER3 in Scp-1 p000 cells. (C) Graph depicting the antiphase circadian expression patterns of miR-181a and PER3 in Scp-1 p181a cells. (D) Graphs depicting the amplitude changes in circadian expression patterns of PER3 and PPARG in the Scp-1 p181a vs p000 cells. (E) Quantification of the amplitude changes in PPARG and PER3 in the Scp-1 p181a vs p000 cells. (F) Graphs depicting the phase shift changes in circadian expression patterns of PER3 and PPARG in the Scp-1 p181a vs p000 cells. (G) Quantification of the phase-shift changes in PPARG and PER3 in the Scp-1 p181a vs p000 cells. Data are representative of 3 independent experiments. * is p ≤ 0.05, ** is p ≤ 0.005, *** is p ≤ 0.0005.

