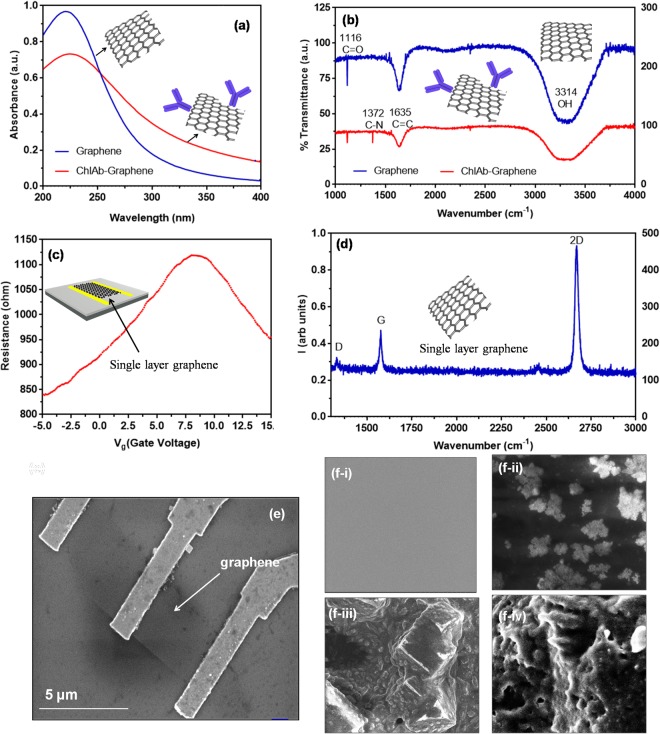
Figure 2.
(a) UV-Vis spectra of graphene (peak at 230 nm) and graphene-chl-Ab (peak at 240 nm); (b) FT-IR spectrum of graphene (red) and graphene labelled with chl-antibody (blue) confirmed the labelling by showing a peak of 1372 cm−1 for C-N while 1116 and 1635 cm−1 peaks are shared in both cases for C=O and C-C, respectively; (c) R vs Vg of the FET showing ambipolar transport; (d) Raman spectrum of the graphene used in the FET showing characteristic 2D peak at ~2600 cm−1 confirming the single layer nature; (e) SEM micrograph of device showing gold electrode connected with the surface of graphene. The red dashed line showed the boundary of graphene. The scale bar is 5 μms; (f-i) SEM morphology of graphene, (f-ii) graphene-Chl-Ab (white globular structures), (f-iii) graphene-Chl-Ab blocked with BSA, and (f-iv) graphene-Chl-Ab bound with Chl-Antigen (Ag).

