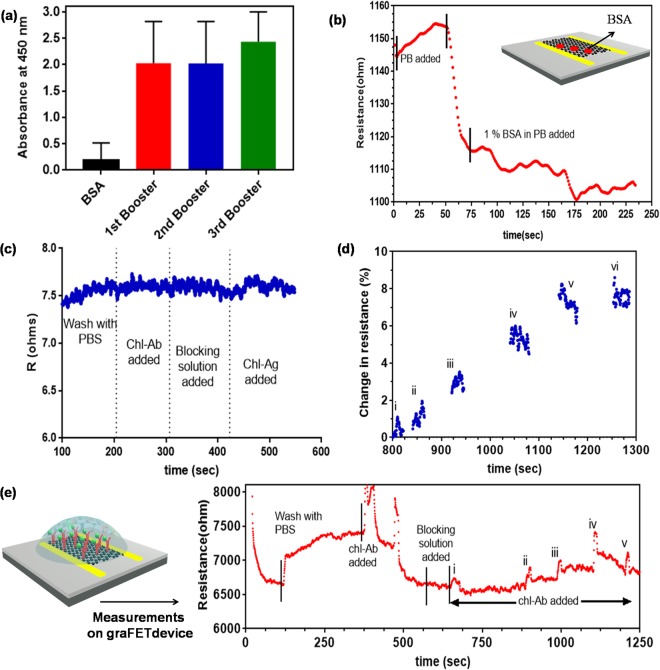
Figure 3.
(a) Binding of chl-Abs with BSA, and chl-BSA. The concentration of Chl-Abs was 0.1 μg/mL; (b) R of graphene channel showed a dip when reacting with 1% BSA in PB. (c) The change in resistance was recorded on the gold surface without graphene does not show antibody binding, reconfirmed that signal obtained from graphene network; (d) Calibration curve resultant from the immunoreactions showed the % R as a function of time for different concentrations of chl-Ag. (e) Schematic representation of Chl-Abs-gra-FET sensor; Kinetic response from the gra-FET at each step and after exposure of free chl at different concentrations: (i) 1 fM (ii) 10 fM (iii) 100 fM (iv) 1 pM (v) 10 pM, and (vi) 100 pM in PB, pH 7.4.

