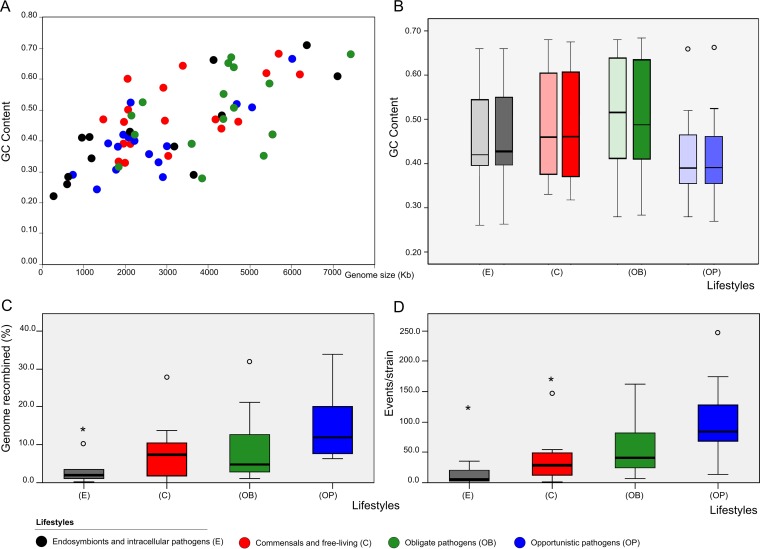
FIG 2.
HR characteristics and lifestyle effect. Four lifestyles are represented in all the figures by the same color code: black, endosymbionts and intracellular pathogens; blue, opportunistic pathogens; red, commensal and free-living pathogens; green, obligate pathogens (green). (A) GC content among 54 species included in this study distributed in 4 lifestyles. (B) Box plot comparing average levels of GC content in recombinant events (solid color; right paired boxes) and whole genomes (grayed-out color; left paired boxes). (C and D) HR distribution (events/strain) (C) and proportion of genome recombined (D) based on lifestyle distributions (both P < 0.05 [Kruskal-Wallis and Jonkheere-Tepstra tests]).

