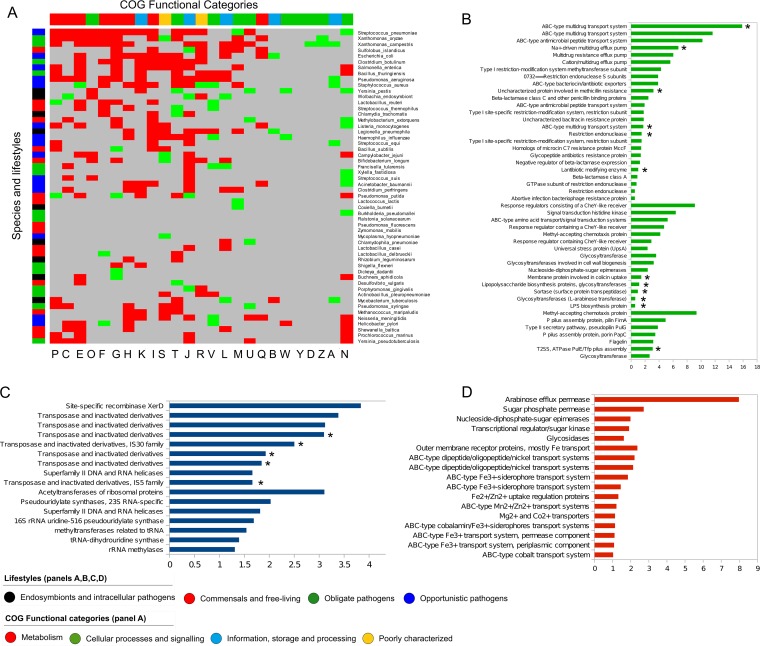
FIG 6.
Gene flow and adaptive implications. (A) Heat map for similarity matrix representing the grouping of 54 species analyzed based on their profile and on those with significantly enriched (green) or underrepresented (red) genes (P < 0.05 [Fisher’s test; FDR correction, <0.1]). The x axis shows the layout of the functional categories and the y axis the species analyzed. (B to D) Distribution (%) of the most abundant GO terms among HR events and associated with (B) “Information, processing and storage and cellular processes” COG categories (red), (C) “Cellular processes and signaling” COG categories (dark blue), and (D) “Metabolism” COG categories (red). GO terms that presented significant enrichment or underrepresentation are marked with an asterisk (*) (P < 0.05, pFDR < 0.05 [Fisher’s exact test]).

