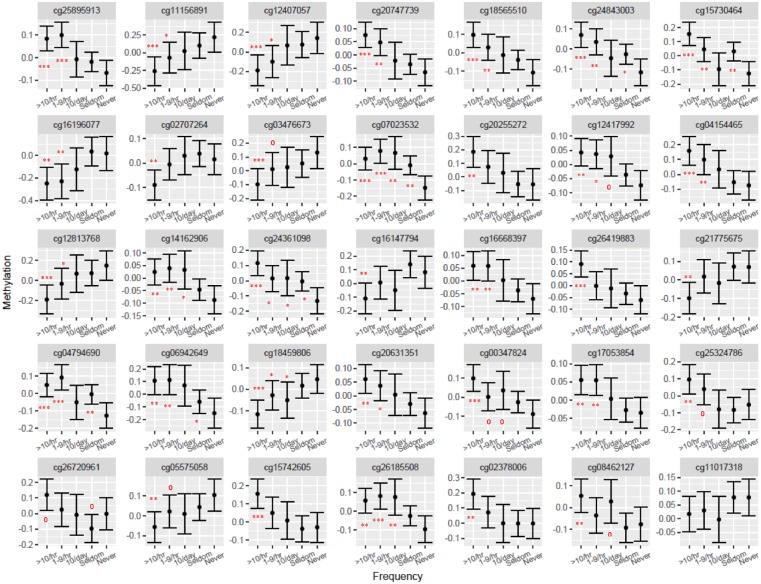
Figure 2:
Adjusted means (with 95% confidence limits) for DNA-M of 35 significant CpG sites associated with the frequency of heavy vehicles that passed by subjects’ homes for a subset of the IoW birth cohort, F1 generation (range of sample size: 336–369). Adjustments depended on CpG site under consideration and included: Maternal Smoking; Tobacco Smoke Exposure (0–4 years and/or at 10 years); SES; BMI; gender; current smoking status; exposure to smoke outside the home. ***P < 0.001; **P < 0.01; *P < 0.05; P < 0.1. Once the Dunnett’ tests provided statistical evidence of differences in marginal means of the heavy vehicular traffic frequency, a second test for trend is performed to assess a ‘dose–response’ relationship

