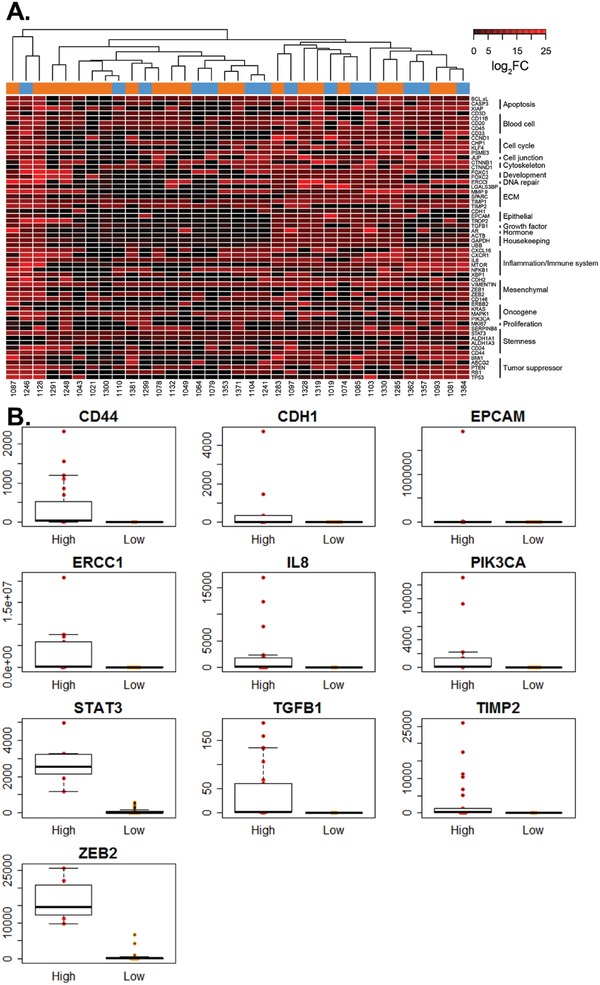
Figure 3.

Relative gene expression for use in a bimodal score. A) Heatmap of log2 fold changes (FC) relative to healthy control background for 58 genes detected in patient samples. Associated gene categories are shown to the right of the gene list. Color coding above the heatmap indicates the presence (orange) or absence (blue) of clusters in a sample. B) Beeswarm plot of expression (2−ΔΔ C t) for genes enabling stratification based on overall survival.
